Architecture
How the viewer is put together: the in-memory profile model, the derived render structures, and the design principles the renderer follows.
Diagrams:
data-model-structure.svg(tables + relationships),data-model-validation.svg(formats × operations).

Data model
One canonical model underpins every view (graph, chart, sandwich, diff, metrics, and scale). Parsers normalize each input format into it; views read from it. The shape is an interned structure-of-arrays plus a prefix-tree for stacks: every non-string table stores integer indices, and aggregation happens at render time, never at ingest.
Shared, interned tables (one per profile)
stringTable — string[]. All names/paths are interned; everything else stores int indices into it.
funcTable (a source-level function) — parallel arrays, length = #funcs:
| column | type | notes |
|---|---|---|
name | int → stringTable | |
file | int → stringTable, or -1 | |
line | int, or -1 | definition line |
Identity (for interning and cross-profile diff): name#file.
frameTable (a specific execution point; supports inlining):
| column | type | notes |
|---|---|---|
func | int → funcTable | |
line | int, or -1 | call-site line |
inlineDepth | int | 0 = real frame, >0 = inlined |
Identity: func#line#inlineDepth.
stackTable (the prefix tree — the scale win):
| column | type | notes |
|---|---|---|
frame | int → frameTable | |
prefix | int → stackTable, or -1 | parent stack node |
A full call stack is one int (the stack index); walk prefix to the root. Identity: frame#prefix (interned, so identical stacks share a node).
Per-thread
Thread — name, optional tid/pid, and a samples table:
| column | type | notes |
|---|---|---|
stack | int[] → stackTable | stack at each sample |
weightsByType | { ValueType → number[] } | signed; multi-value |
time | number[] | present iff hasTiming |
Weights are stored per value-type, so the value-type selector switches columns instantly. Files that carry several values (e.g. pprof’s [samples, cpu_nanos]) keep all of them; a streamed source that can only afford one populates a single column — the shape holds either way. Weights are signed so diff falls out for free (the baseline is negative, merge-summed).
Profile (container) + capability flags
Profile {
  stringTable, funcTable, frameTable, stackTable
  threads: Thread[]
  metrics: MetricSeries[]          // sibling time-series, aligned by timestamp
  capabilities: {
    hasTiming:   boolean           // samples carry time[] → flame chart + metric coupling
    weightTypes: ValueType[]       // e.g. SAMPLES, CPU_NANOS, ALLOC_BYTES, IO_BYTES
    isDiff:      boolean           // weights may be negative
  }
}
ValueType is extensible: SAMPLES, CPU_NANOS, WALL_NANOS, ALLOC_BYTES, ALLOC_OBJECTS, IO_BYTES.
Inlined frames are representable via inlineDepth (inlined functions can render as their own boxes, and diff keys stay stable); a loader may collapse inlines initially by setting inlineDepth = 0, with no model change needed when full fidelity is added.
Derived at load (not from the source)
CallNodeTable — the merged call tree for rendering, as typed arrays (prefix, func, depth as Int32Array, plus nextSibling, subtreeRangeEnd). A first-child-at-index+1 layout gives allocation-free traversal. Pruning and virtualization operate here. It is rebuilt per view (top-down for the graph, inverted for sandwich, grouped for left-heavy).
MetricSeries — { name, unit, time: number[], value: number[] }, aligned to a thread’s time axis by timestamp. Multiple per profile.
Every field justified by an operation
A field exists only if an operation needs it:
| Operation | Requires |
|---|---|
| Flame graph | stackTable + weights (any type) |
| Left-heavy | derived grouped CallNodeTable |
| Flame chart (time) | samples.time (hasTiming) + per-sample stacks |
| Sandwich | inverted CallNodeTable + frame identity |
| Auto-collapse | single-child detection on CallNodeTable |
| Search | func names (stringTable) |
| Diff | signed weights + frame identity across profiles |
| Metric coupling | samples.time + aligned MetricSeries |
| Value-type selector | weightsByType |
Format × operation coverage
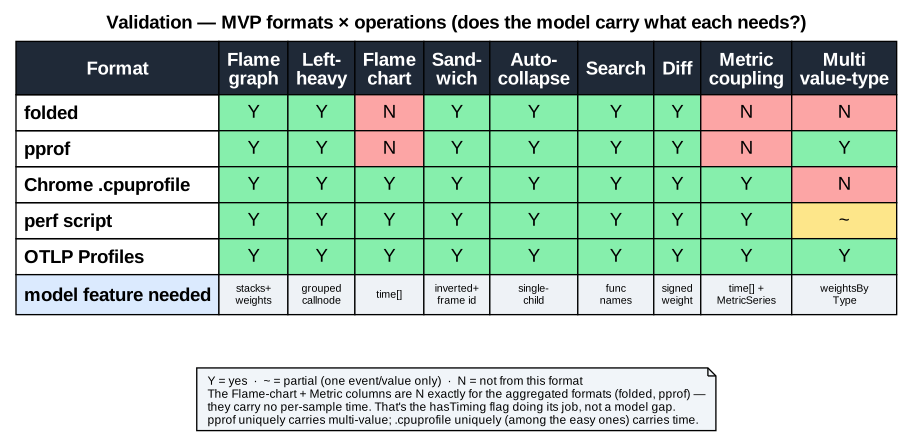
| Format | graph | left-heavy | chart | sandwich | collapse | search | diff | metric | multi-value |
|---|---|---|---|---|---|---|---|---|---|
| folded | ✅ | ✅ | ❌ | ✅ | ✅ | ✅ | ✅ | ❌ | ❌ |
| pprof | ✅ | ✅ | ❌ | ✅ | ✅ | ✅ | ✅ | ❌ | ✅ |
Chrome .cpuprofile | ✅ | ✅ | ✅ | ✅ | ✅ | ✅ | ✅ | ✅ | ❌ |
| perf script | ✅ | ✅ | ✅ | ✅ | ✅ | ✅ | ✅ | ✅ | ⚠️ |
| Gecko | ✅ | ✅ | ✅ | ✅ | ✅ | ✅ | ✅ | ✅ | ❌ |
| JFR | ✅ | ✅ | ✅ | ✅ | ✅ | ✅ | ✅ | ✅ | ❌ |
| OTLP Profiles | ✅ | ✅ | ❌ | ✅ | ✅ | ✅ | ✅ | ❌ | ✅ |
macOS sample(1) | ✅ | ✅ | ❌ | ✅ | ✅ | ✅ | ✅ | ❌ | ❌ |
The chart/metric columns are ❌ exactly for the aggregated formats (folded, pprof, OTLP) — they carry no per-sample time. That is the hasTiming flag working as designed: the UI hides the chart tab when hasTiming is false. Every format maps in; every operation reads out or is explicitly unavailable.
Invariants
- All indices are valid into their target table, or the
-1sentinel. stackTable.prefixforms a forest rooted at-1(acyclic).- Interning holds: identical
funcTable/frameTable/stackTablekey → same index. - If
hasTiming:samples.timeis non-decreasing andtime.length == stack.length. - Single-source profiles: weights
≥ 0. Diff profiles (isDiff): weights may be±. - Every
ValueTypeincapabilities.weightTypeshas a column in every thread’sweightsByType. MetricSeriesshares the thread’s time origin/unit.
Out of scope for the model
- Remote/query concerns — a source adapter emits this model; it isn’t part of it.
- Symbolication — assumed done upstream.
- Native address / symbol columns — a later seam (optional
address/nativeSymbolon frameTable); not in the core. - It models one workload’s threads (+ aligned metrics), not an open-ended panel set.
View modes & feature support
The viewer offers four flame modes plus an alternate radial rendering. Not every feature applies to every mode — most of the differences fall out of the data model (e.g. a time-ordered view needs per-sample timing). Internal mode keys are chart / graph / sandwich / diff.
| Mode (label) | Internal key | Needs timing | Overview minimap + crop | Auto-collapse | Hover highlight | Detail panel |
|---|---|---|---|---|---|---|
| Timeline | chart | ✅ required | ✅ time window | — | all instances of fn | This / All / stack |
| Aggregated | graph | — | ✅ value-fraction | ✅ | ancestor↔descendant path | This / All / stack |
| Sandwich | sandwich | — | — | — | all instances of fn | This / All / stack |
| Diff | diff | — | ✅ value-fraction | — | ancestor↔descendant path | Δ only |
Common to all modes: regex search + dim, zoom/focus (Timeline crops a time span, Aggregated/Diff focus a subtree, Sandwich re-centers on the focal function), the value-type (weight) selector, and semantic color / theming.
- Timeline is offered only when the profile carries per-sample time (
hasTiming); the UI hides it for aggregated formats (folded, pprof). - Auto-collapse of boring single-child chains applies only to Aggregated.
- Hover highlight lights the full ancestor↔descendant call path in Aggregated/Diff; in Timeline/Sandwich it lights every instance of the hovered function instead.
- Diff shows per-node Δ in the detail panel (no All-Instances/stack breakdown).
- Radial (sunburst) is an alternate rendering of the Aggregated view (FG-039): same aggregated data as a radial layout, no minimap and no collapse.
Rendering & design principles
The renderer is a single Canvas 2D surface (getContext('2d', { alpha:false }), rAF-throttled, DPR-aware), with text drawn on the same canvas. The visual language follows one governing rule:
Restyle anything that does not carry data — borders, the vertical (depth) treatment, color, motion-on-interaction. Never restyle the thing that does: horizontal width. At every level, x-extent is the metric. That single line decides every visual question.
Width is sacred
Any silhouette change that makes width ambiguous breaks the one thing a flame graph is trusted for. Slanted or notched edges make a box’s start/end ambiguous and break left-edge alignment between a child and its place in the parent — a real containment cue traded for a decorative one. An arrow/chevron implies flow, which is honest only where the x-axis is time: reserve arrow shapes for the time-ordered chart, never the aggregated graph (where left→right means nothing).
Borderless — separate with gaps, not strokes
Boxes carry no stroke; separation comes from a ~1px background gap (pull each box’s edge in slightly so the background shows through). A gap is sharper and cheaper than a drawn line and never competes with the fill. This only degrades gracefully alongside sub-pixel pruning — you can’t put a 1px gap on a 2px box — so borderless and pruning are the same decision. Avoid bevels / inner highlights; stay flat and let gaps and fill do the work.
Vertical rhythm is free design space
Depth is ordinal — nobody measures box height — so the y-treatment is open. A consistent row height reads as “clean” on its own. A barely-there luminance step between depth levels separates rows with zero lines. Optional small touches (a hair of child/parent overlap; ≤1–2px top-corner rounding that’s dropped below a width threshold) reinforce nesting without touching width.
Auto-collapse boring chains
A single-child chain where the child’s weight is ~equal to the parent’s (a→b→c→d, each calling only the next) carries no branching information yet eats vertical space. Folding it into one bar with an (N) badge is honest — the weights are identical, nothing is lost — and de-clutters deep stacks. Requirements: an affordance for hidden depth (badge / chevron) so a collapsed chain doesn’t read as a leaf; layout stability so the user doesn’t lose their place; and a conservative heuristic that only folds near-equal-weight single-child chains, never branch points.
Hide controls, never state
Chrome is summoned on demand; the data is full-bleed. Controls (the command palette, search, context menu, legend, help) appear when asked for and get out of the way. But the state a reading depends on — the current mode, the active weight type, whether a diff is on — stays visible at all times in the status strip. A frame’s width means different things in Timeline versus Aggregated, so hiding the current mode is a correctness bug, not a cosmetic one. View modes stay discoverable as a minimal always-visible segmented control, never palette-only.
Interaction removes static load
Interactivity’s real value is that it lets the resting state be calmer and denser: drop labels on narrow boxes and reveal the full name on hover (the label never has to fit); keep resting color intensity low and light up the ancestor→descendant path on hover while dimming the rest. Follow overview → zoom → filter → details-on-demand. (Interaction solves exploration density, not static-export density, so it pairs with the legibility moves above rather than replacing them.)
Color means something
The legacy default — a hash of the function name mapped to a red/orange/yellow ramp — is both garish and informationally empty. The progression that fixes it:
| Scheme | Pretty? | Useful? |
|---|---|---|
| Random hash | ❌ | ❌ encodes nothing |
| Semantic / categorical (by module/package/language) | ✅ | ✅ groups related code |
| Value shading (darker/saturated = hotter) | ✅ | ✅ encodes the metric |
| Semantic hue + value shading | ✅ | ✅✅ two signals, no clutter |
Color hue encodes module/package (not a hash); intensity can encode the metric. Palettes are low-saturation and legend-able. A genuinely good dark mode is the default (this is a dev tool viewed in dark editors), and palettes should be colorblind-safe. Diff uses a diverging scale: red = more in the comparison (regression), blue = less (improvement), grey ≈ unchanged.
The principle throughout: clarity, not decoration. Gradients, drop-shadows, and 3D bevels distort width perception and waste pixels; the best-looking flame graph is the one where color carries signal and the type is readable — which is also the most useful one.
Scale via “draw less”
Draw cost is viewport-bounded, not sample-count-bounded: sub-pixel subtree pruning caps the number of drawn boxes at roughly width × depth regardless of profile size, and hit-testing is a CPU scan of the boxes in the hovered row (depth derived from y). Deep stacks (>~1000 levels) would add row-level vertical virtualization on the same CallNodeTable.