Draw the graph in Grafana
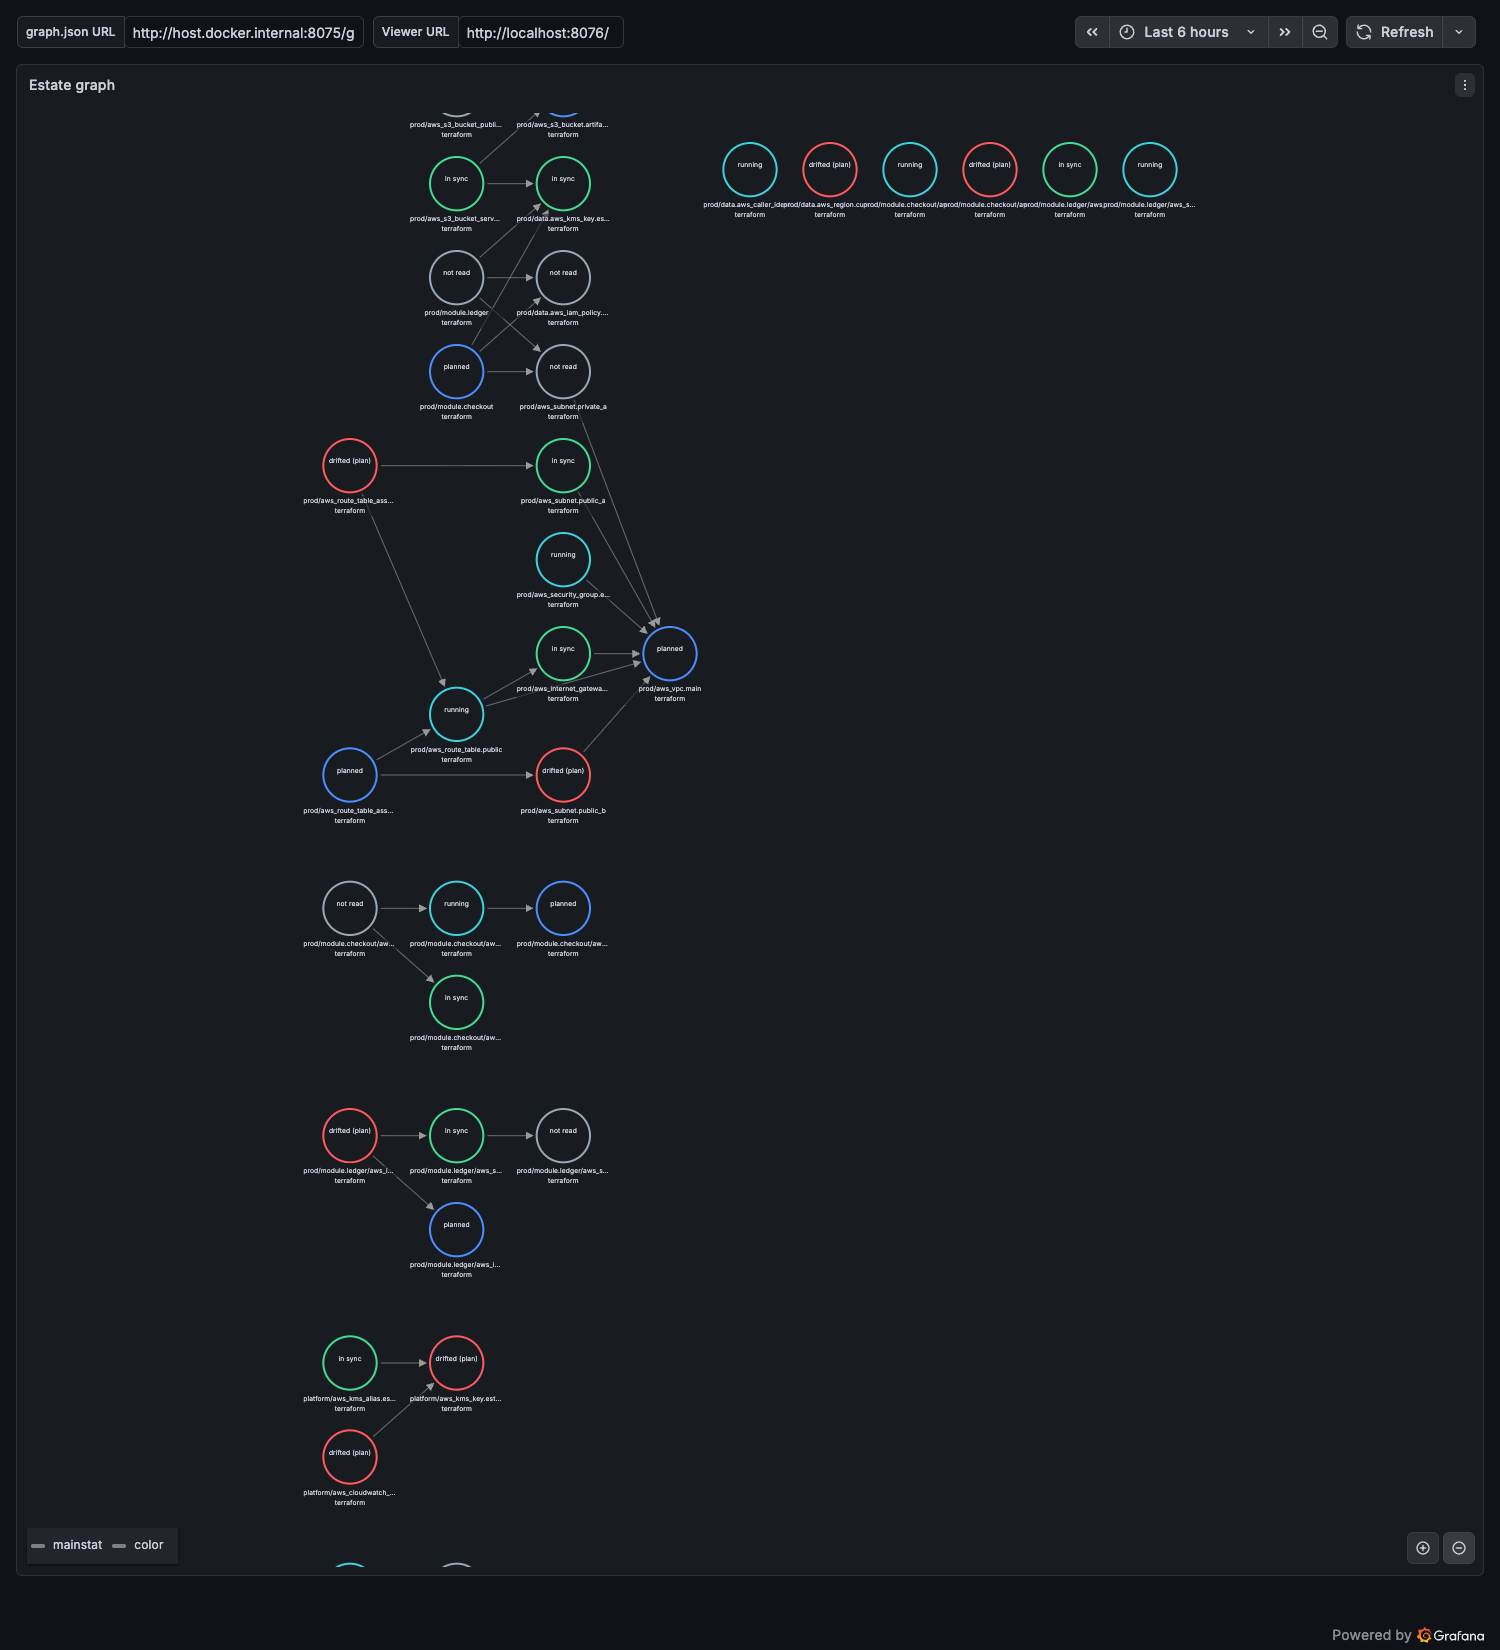
Grafana’s built-in node graph panel draws a nodes list and an edges list, and the graph document uses the same field names. So a dashboard that reads a published graph.json with the Infinity data source draws the estate with no plugin of ours. Clicking a node opens the hosted viewer on that node.
What you need
Section titled “What you need”- A
graph.jsonat a URL Grafana’s server can fetch. Publish to GitHub Pages gives you one athttps://<owner>.github.io/<repo>/graph.json, and the viewer at the same site. - Grafana with the Infinity data source installed. This page was checked on Grafana 13.0.2 with Infinity 4.1.6.
Set it up
Section titled “Set it up”- Add an Infinity data source. Under Security, add the origin that serves
graph.json(for examplehttps://<owner>.github.io) to Allowed hosts. Infinity refuses a URL that is not on the list. Authentication can stay “None” for a public site. - Download one of the dashboards below, then Dashboards > New > Import, upload the file and pick the Infinity data source.
- Set the two dashboard variables:
graph_url, the address ofgraph.json, andviewer_url, the address of the viewer with the trailing slash.
| Dashboard | Use it when |
|---|---|
| behold-graph.dashboard.json | The export carries no status, which is the default. Nodes draw as grey rings. |
| behold-graph-status.dashboard.json | The export was written with an overlay, so nodes carry color and mainstat. Each ring takes its status colour and the node shows its state. |
The two queries
Section titled “The two queries”Both dashboards run two Infinity queries against ${graph_url}, type JSON, source URL, with the Default parser:
| Query | Format | Root selector | Columns |
|---|---|---|---|
| nodes | Nodes - Node Graph | nodes |
id, title, subtitle (and mainstat, color in the status dashboard) |
| edges | Edges - Node Graph | edges |
id, source, target |
subtitle is the tool that declares the card. The panel uses the layered layout and cooperative zoom, which are the node graph panel’s own options.
color is the hex string from behold’s status colours, such as #FF5A5F. The panel takes it as it is: the status screenshot above comes from a graph.json whose nodes carry those values. Leave the color column out when the export has none. A color column that exists but is empty makes the panel draw the node with no ring at all, which is why there are two dashboards.
A column that is not in the lists above is left out on purpose. Grafana turns an extra numeric field such as line into the node’s main stat, and it shows every detail__* field in the click menu under the field’s value rather than its name.
Click a node
Section titled “Click a node”The dashboard puts a data link on the node’s title field, titled “Open in the behold viewer”:
${viewer_url}?node=${__data.fields.id}Click a node, choose the link in the menu, and the viewer opens with that card selected and its inspect pane showing. The viewer reads the node id in the same form that graph.json has it, so the link needs no escaping beyond what the browser does.
Keep it under 200 nodes
Section titled “Keep it under 200 nodes”The node graph panel draws 200 nodes by default and hides the rest behind a warning (47 hidden for a 296-node file in our check), and layered layout is slow above about 500. Point graph_url at a smaller file instead of the whole estate. The simplest slice today is to export one root:
behold export ./infra/envs/prod --out ./slice --no-sourceThat writes ./slice/graph.json for the 17 cards of that root in example-terraform-estate and nothing else. Publish it where the dashboard can read it. A cut around one resource will be able to write the same kind of file once it is available.
Infinity’s query-level filters did not give a way to cut one root out of a larger file. With a backend parser (JSONata or JQ) the node graph formats fail in this Grafana, and a panel transformation on the nodes query makes the panel fail. A smaller file is the supported route.
How fresh it is
Section titled “How fresh it is”The picture is as fresh as the last export. Grafana reads the file each time the dashboard loads or refreshes, so republish graph.json when the estate changes, for example from the same workflow that publishes the viewer.