
Send traces and metrics
 Optional: hand this page to your coding agentThe steps work by hand too.
Show the whole prompt
Read https://intentius.io/terragucci/guides/send-traces-and-metrics/.
Add `OTEL_EXPORTER_OTLP_ENDPOINT` under `env:` in terragucci.yml, `telemetry.headers_secret` if the collector needs a key, and `dashboards: true`.
Run `npx terragucci config check --json` and `npx terragucci init`, and open a pull request with terragucci.yml, the pipeline and observability/terragucci/.
List the secret I must add for my forge; do not create it.
Never apply, approve (a pull request review or `terragucci approve`), override a policy denial (`terragucci override`), use `--mode apply`, or merge; never touch `.chant/allowed_signers` or `chant/lifecycle`.Result
Section titled “Result”Every plan, drift and apply job sends one trace and its metrics over OTLP to your collector, and your Grafana shows nine dashboards and the alerts init writes. Nothing else receives them.
With binary: choudoufu (set it up), the traces and reports also carry provider-call timings, timings summed by resource type on a large estate, and state lock waits.
Prerequisites
Section titled “Prerequisites”| You need | Why |
|---|---|
| The pipeline from Get your first plan note | init adds the variables to its jobs |
| An OpenTelemetry collector with an OTLP/HTTP receiver (port 4318) the runners can reach | the jobs send OTLP/JSON over HTTP, not gRPC |
| Prometheus, through the collector’s Prometheus exporter or remote write | the metrics and the dashboards’ queries |
| Grafana, and Tempo for traces | the dashboards; only the Runs dashboard’s trace list needs Tempo |
An unreachable collector never fails a stage, so you can turn this on before the collector is ready.
-
Point every job at the collector in
terragucci.yml.env:OTEL_EXPORTER_OTLP_ENDPOINT: https://otel-collector.example.com:4318Traces go to
/v1/tracesand metrics to/v1/metricsunder it.envholds values only; a key goes in the next step. Variables lists the other OpenTelemetry variables the jobs read. -
If the collector needs a key, name the secret that holds the headers.
telemetry:headers_secret: OTLP_HEADERSThe generated plan, apply and drift jobs set
OTEL_EXPORTER_OTLP_HEADERSfrom it. Its value iskey=valuepairs, such asx-api-key=abc123.Add a repository secret named
OTLP_HEADERSunder Settings > Secrets and variables > Actions.Under Settings > CI/CD > Variables, add
OTLP_HEADERSas a masked variable.Create the secret
OTLP_HEADERSin Settings > Actions > Secrets.A pull request from a fork gets no secrets.
-
Ask for the dashboards and alerts.
dashboards: trueGrafana datasources not named
prometheusandtemponeed their uids here:dashboards:prometheus: my-prometheustempo: my-tempoDashboard settings lists the folder, path and alert thresholds.
-
Link each report to its trace (optional).
telemetry:headers_secret: OTLP_HEADERStrace_url: "https://grafana.example.com/explore?left=%7B%22datasource%22:%22tempo%22,%22queries%22:%5B%7B%22query%22:%22{trace_id}%22%7D%5D%7D"The report then links the run’s trace instead of printing its id. The Runs and Estate dashboards link back to the reports when
reports.urlis set. -
Check the file and write the pipeline again.
Terminal window npx terragucci config checknpx terragucci initterragucci.yml: okapproval: ledger (the default)initadds the variables to the jobs and writesobservability/terragucci/:File Load it into grafana/dashboards/<uid>.jsonGrafana, at the dashboards path(default/var/lib/grafana/dashboards/terragucci)grafana/provisioning/dashboards/terragucci.yamlGrafana, under /etc/grafana/provisioning/dashboards/grafana/provisioning/alerting/terragucci.yamlGrafana, under /etc/grafana/provisioning/alerting/prometheus/terragucci.rules.ymlPrometheus, in rule_filesPage from the Grafana alerting file or from the Prometheus
ErrorBudgetBurnalerts, not both.initleaves alone any file in that directory it did not write. -
Add the span metrics connector to your collector, for the SLO dashboards:
connectors:spanmetrics:namespace: terragucci.spansdimensions:- name: terragucci.stage- name: terragucci.project- name: terragucci.resultresource_metrics_key_attributes: [service.name, terragucci.project]histogram:unit: sexplicit:buckets: [5s, 15s, 30s, 60s, 120s, 300s, 600s, 1200s, 1800s, 3600s] -
Open and merge a pull request with
terragucci.yml, the pipeline andobservability/terragucci/. -
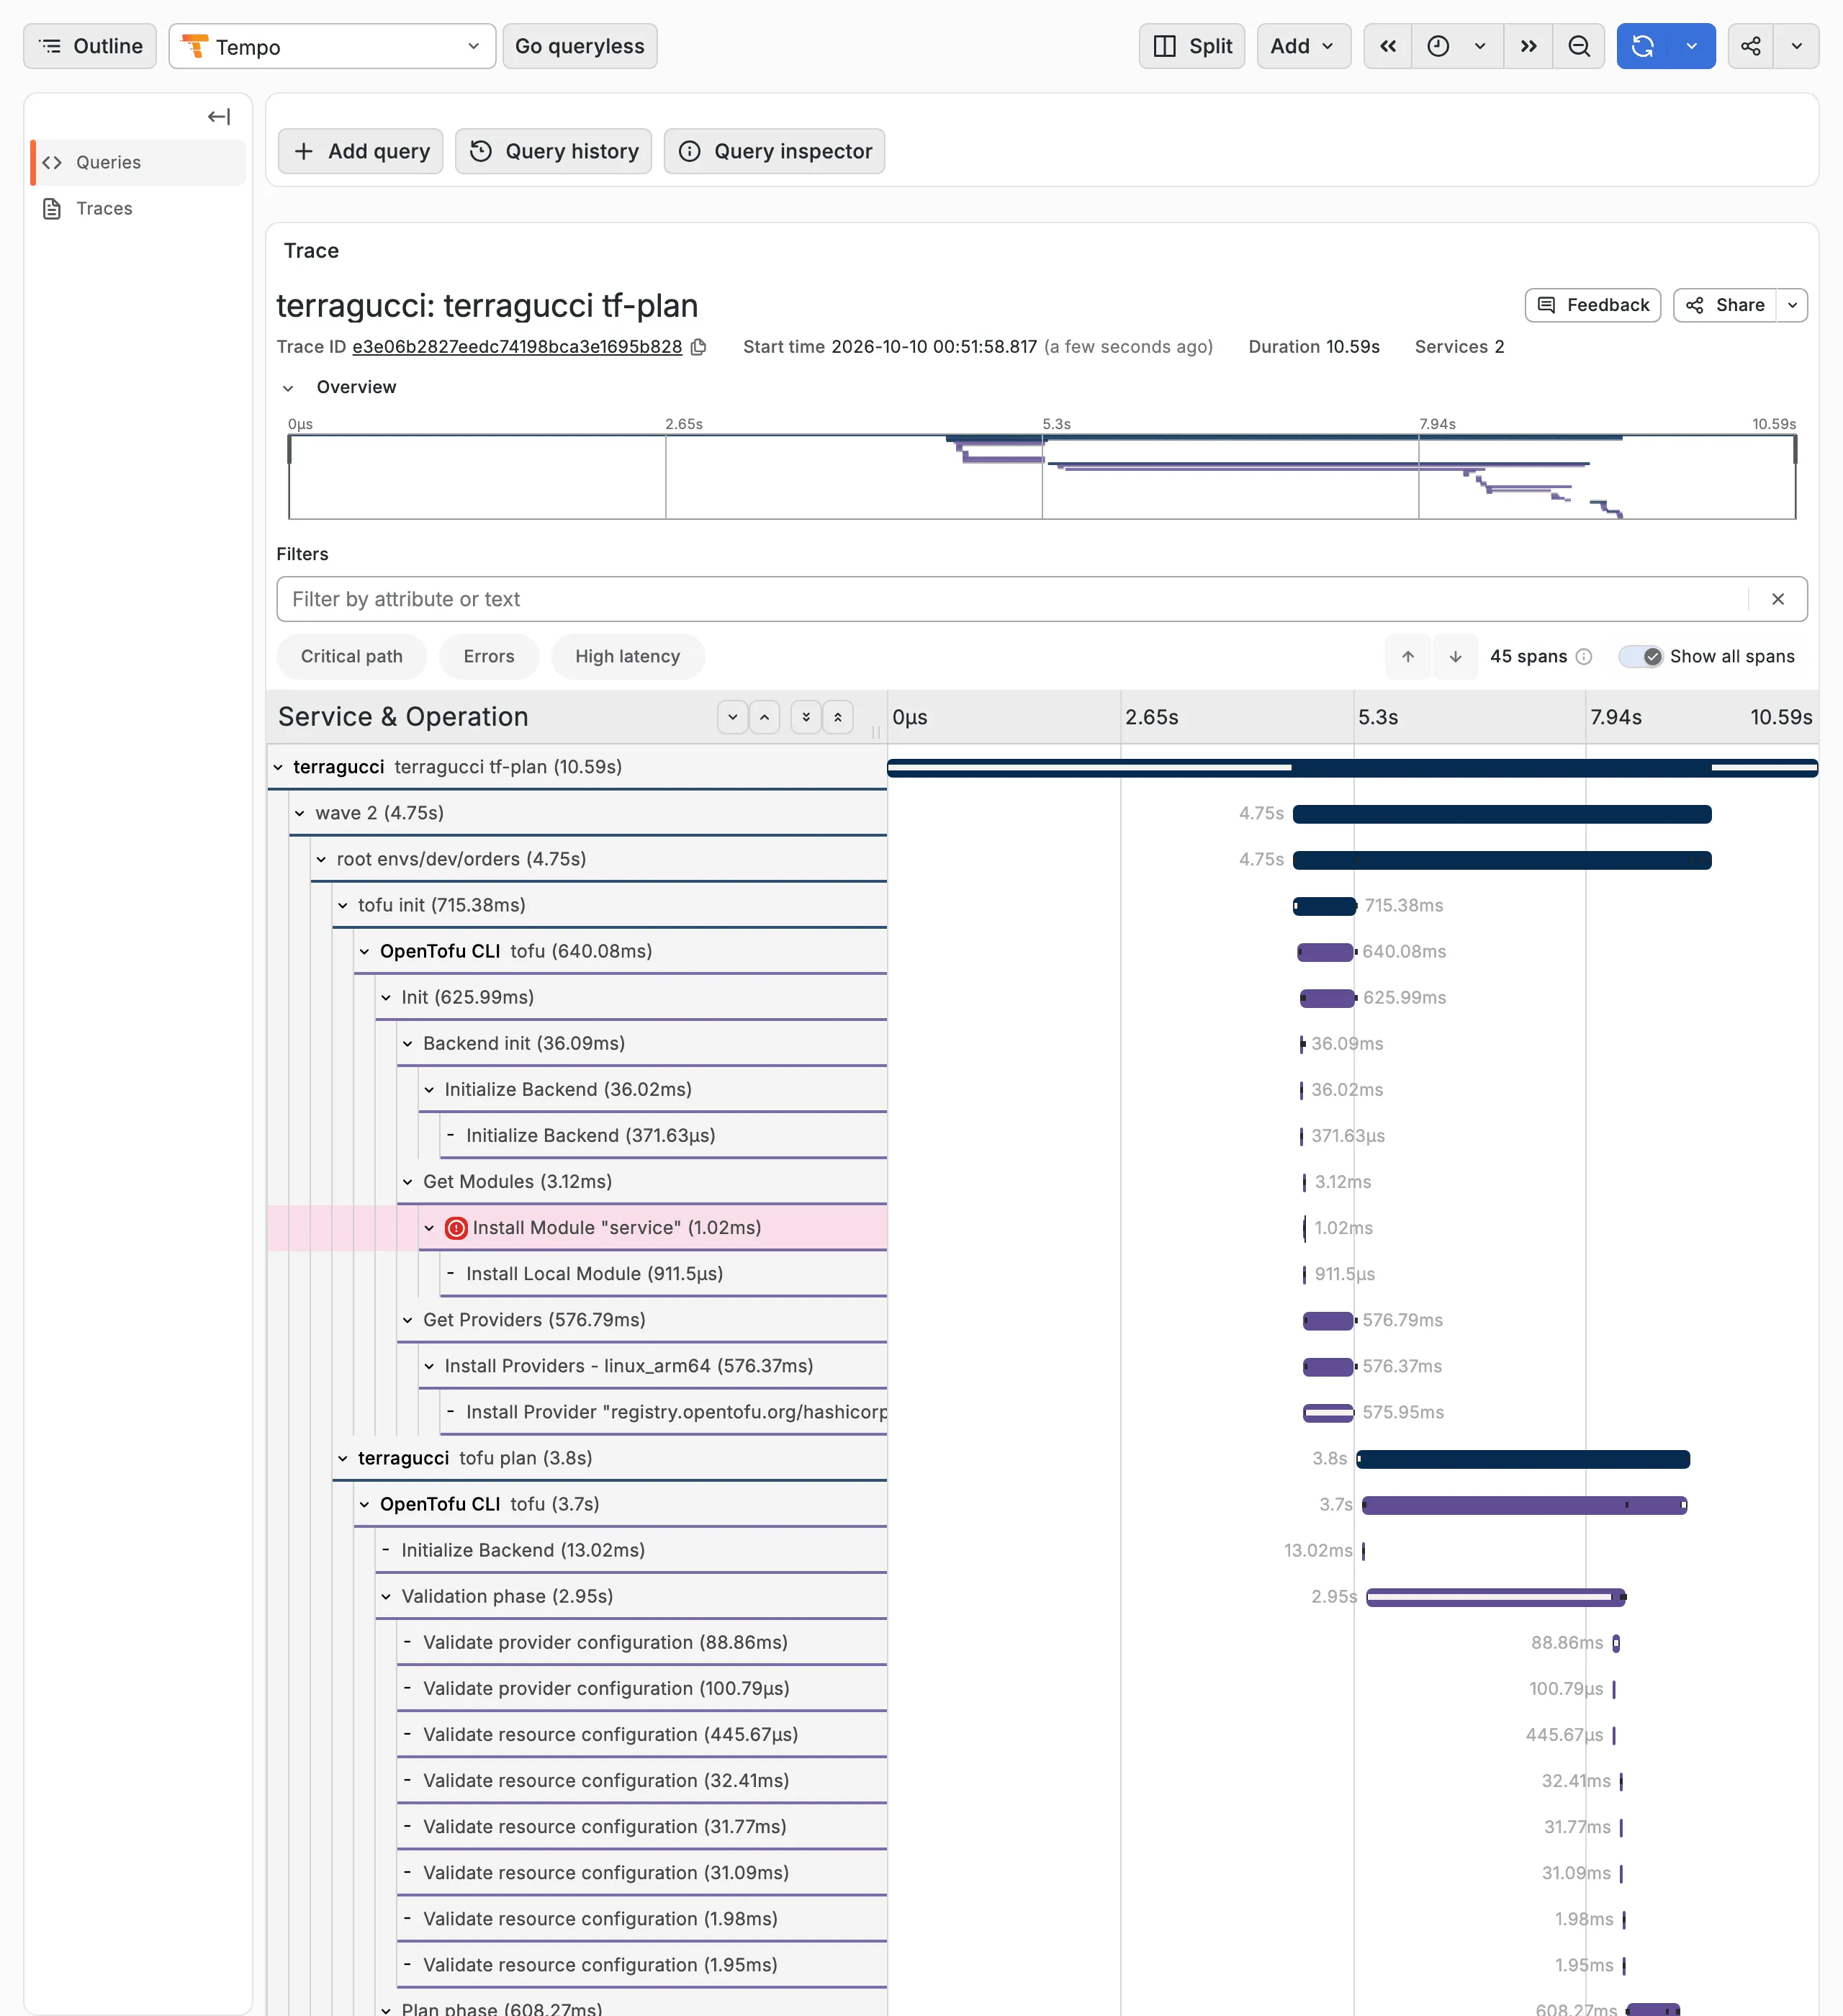
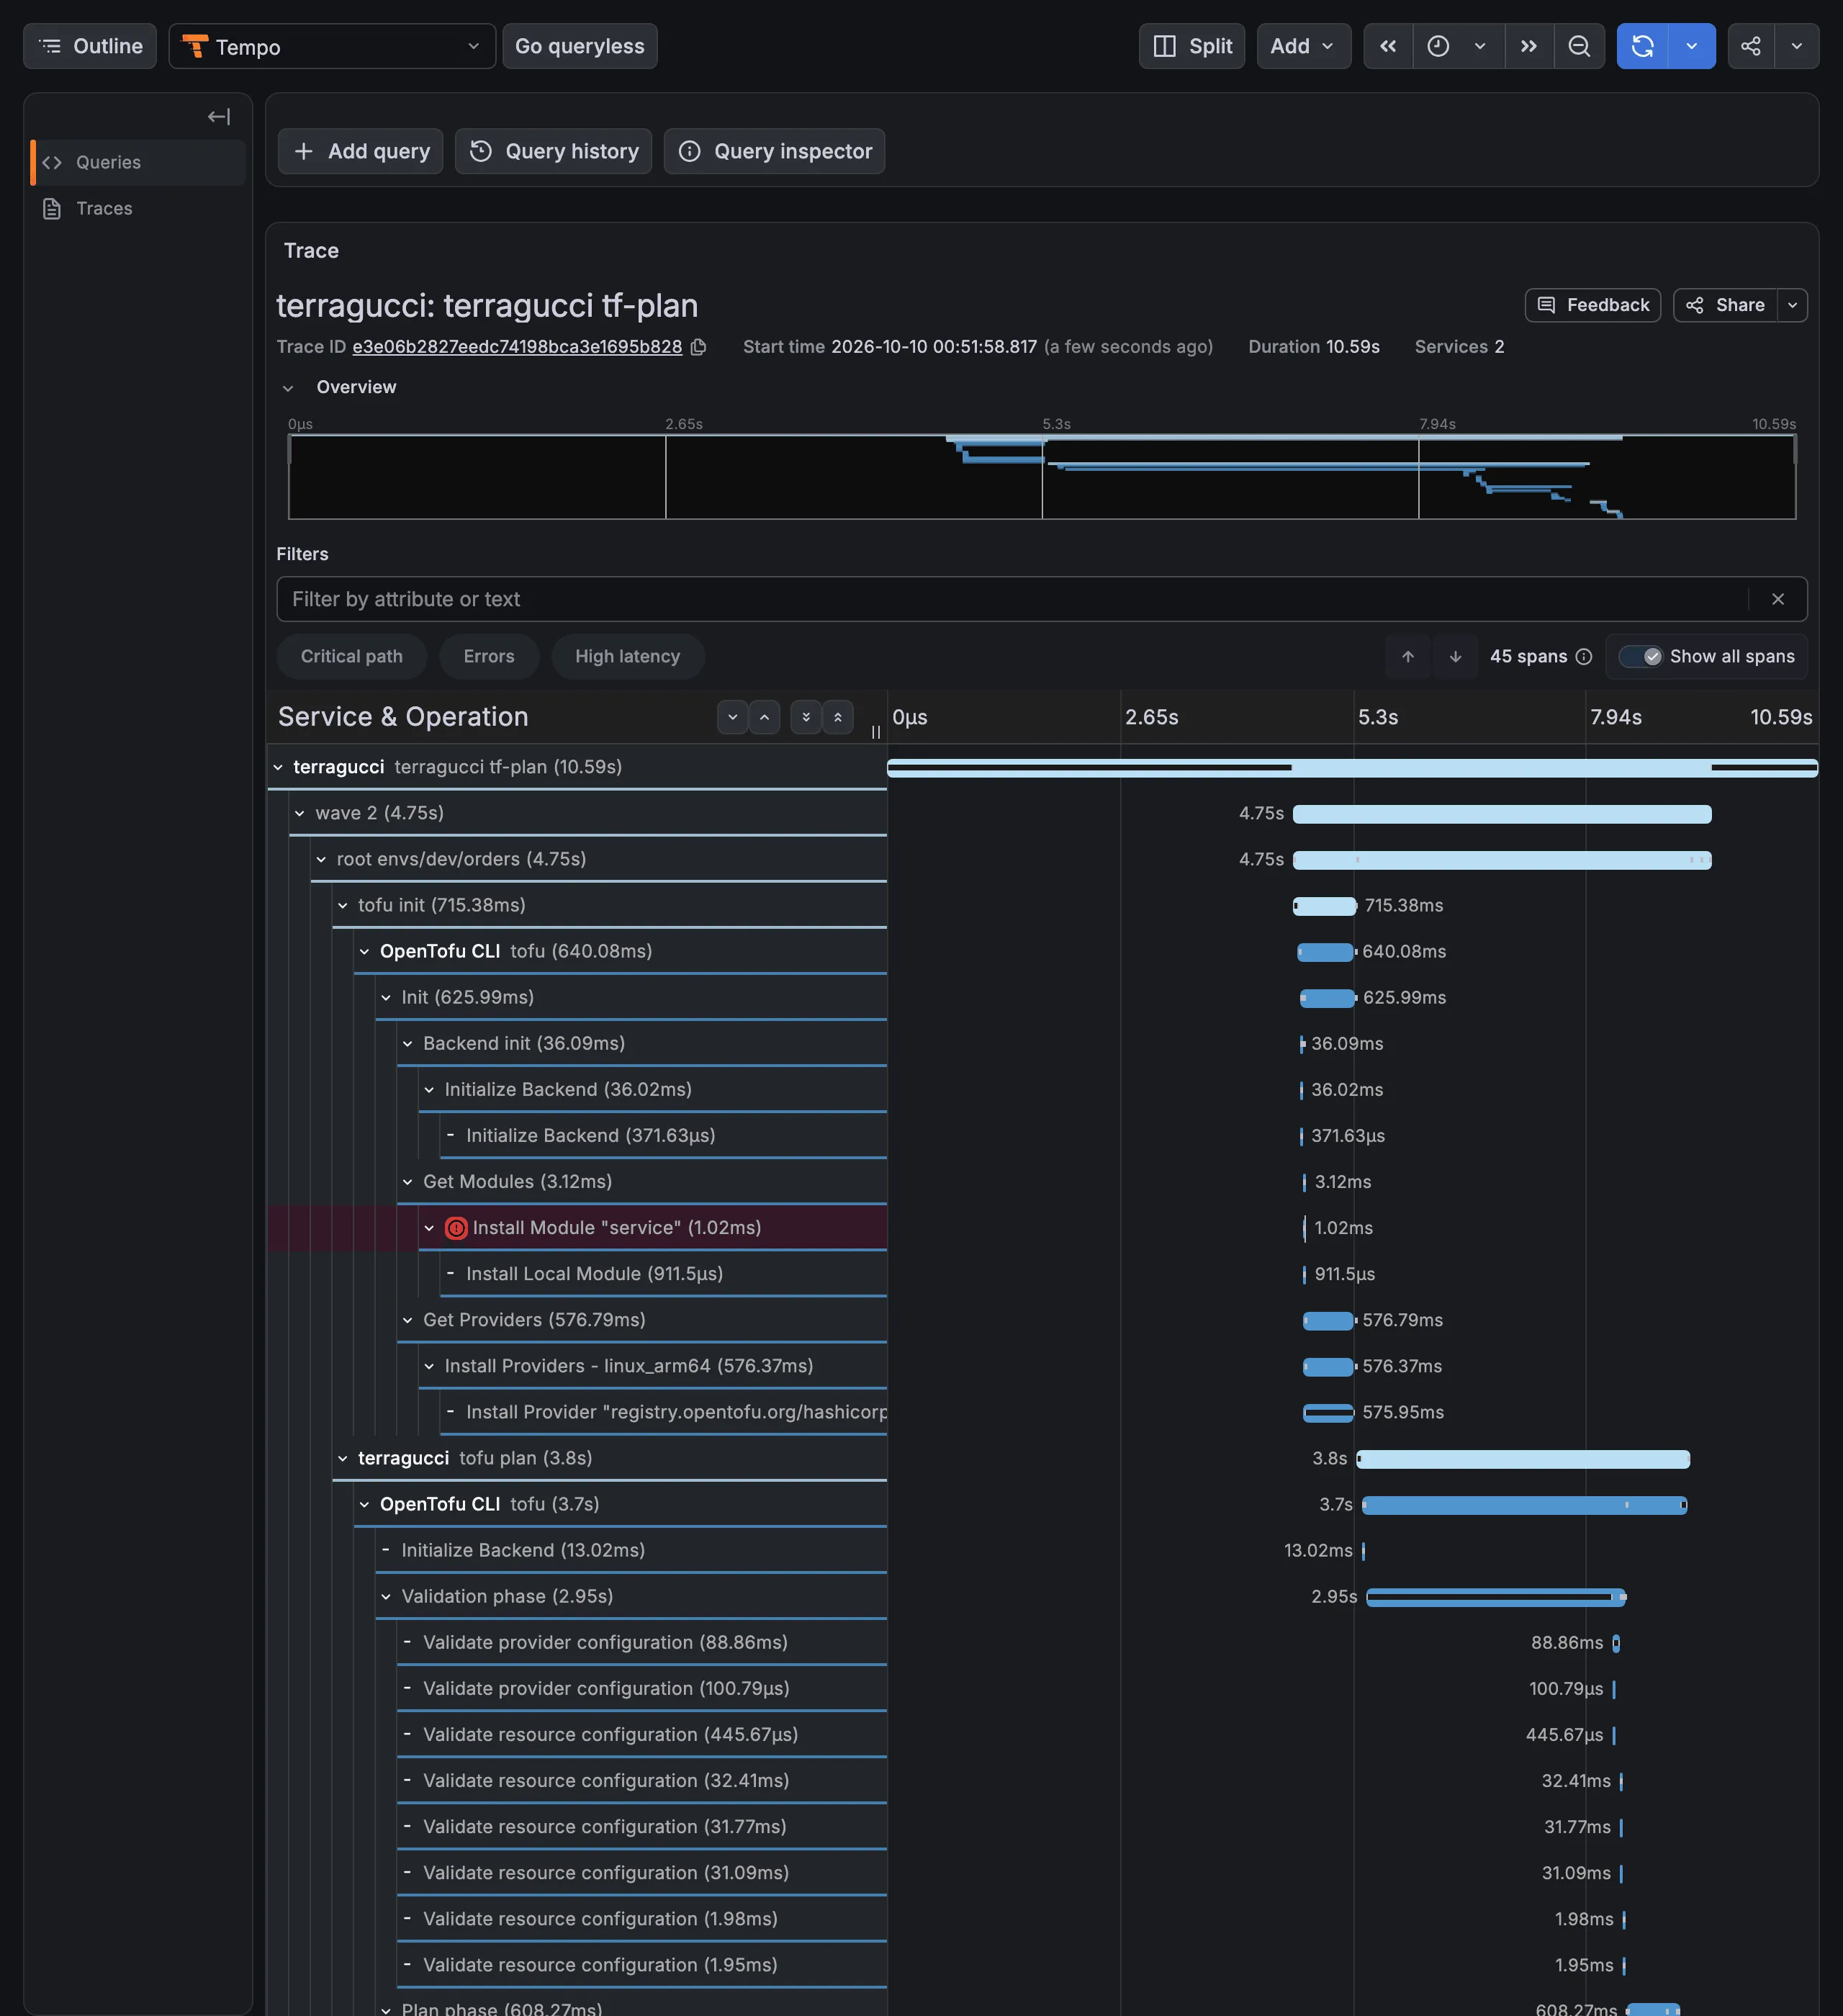
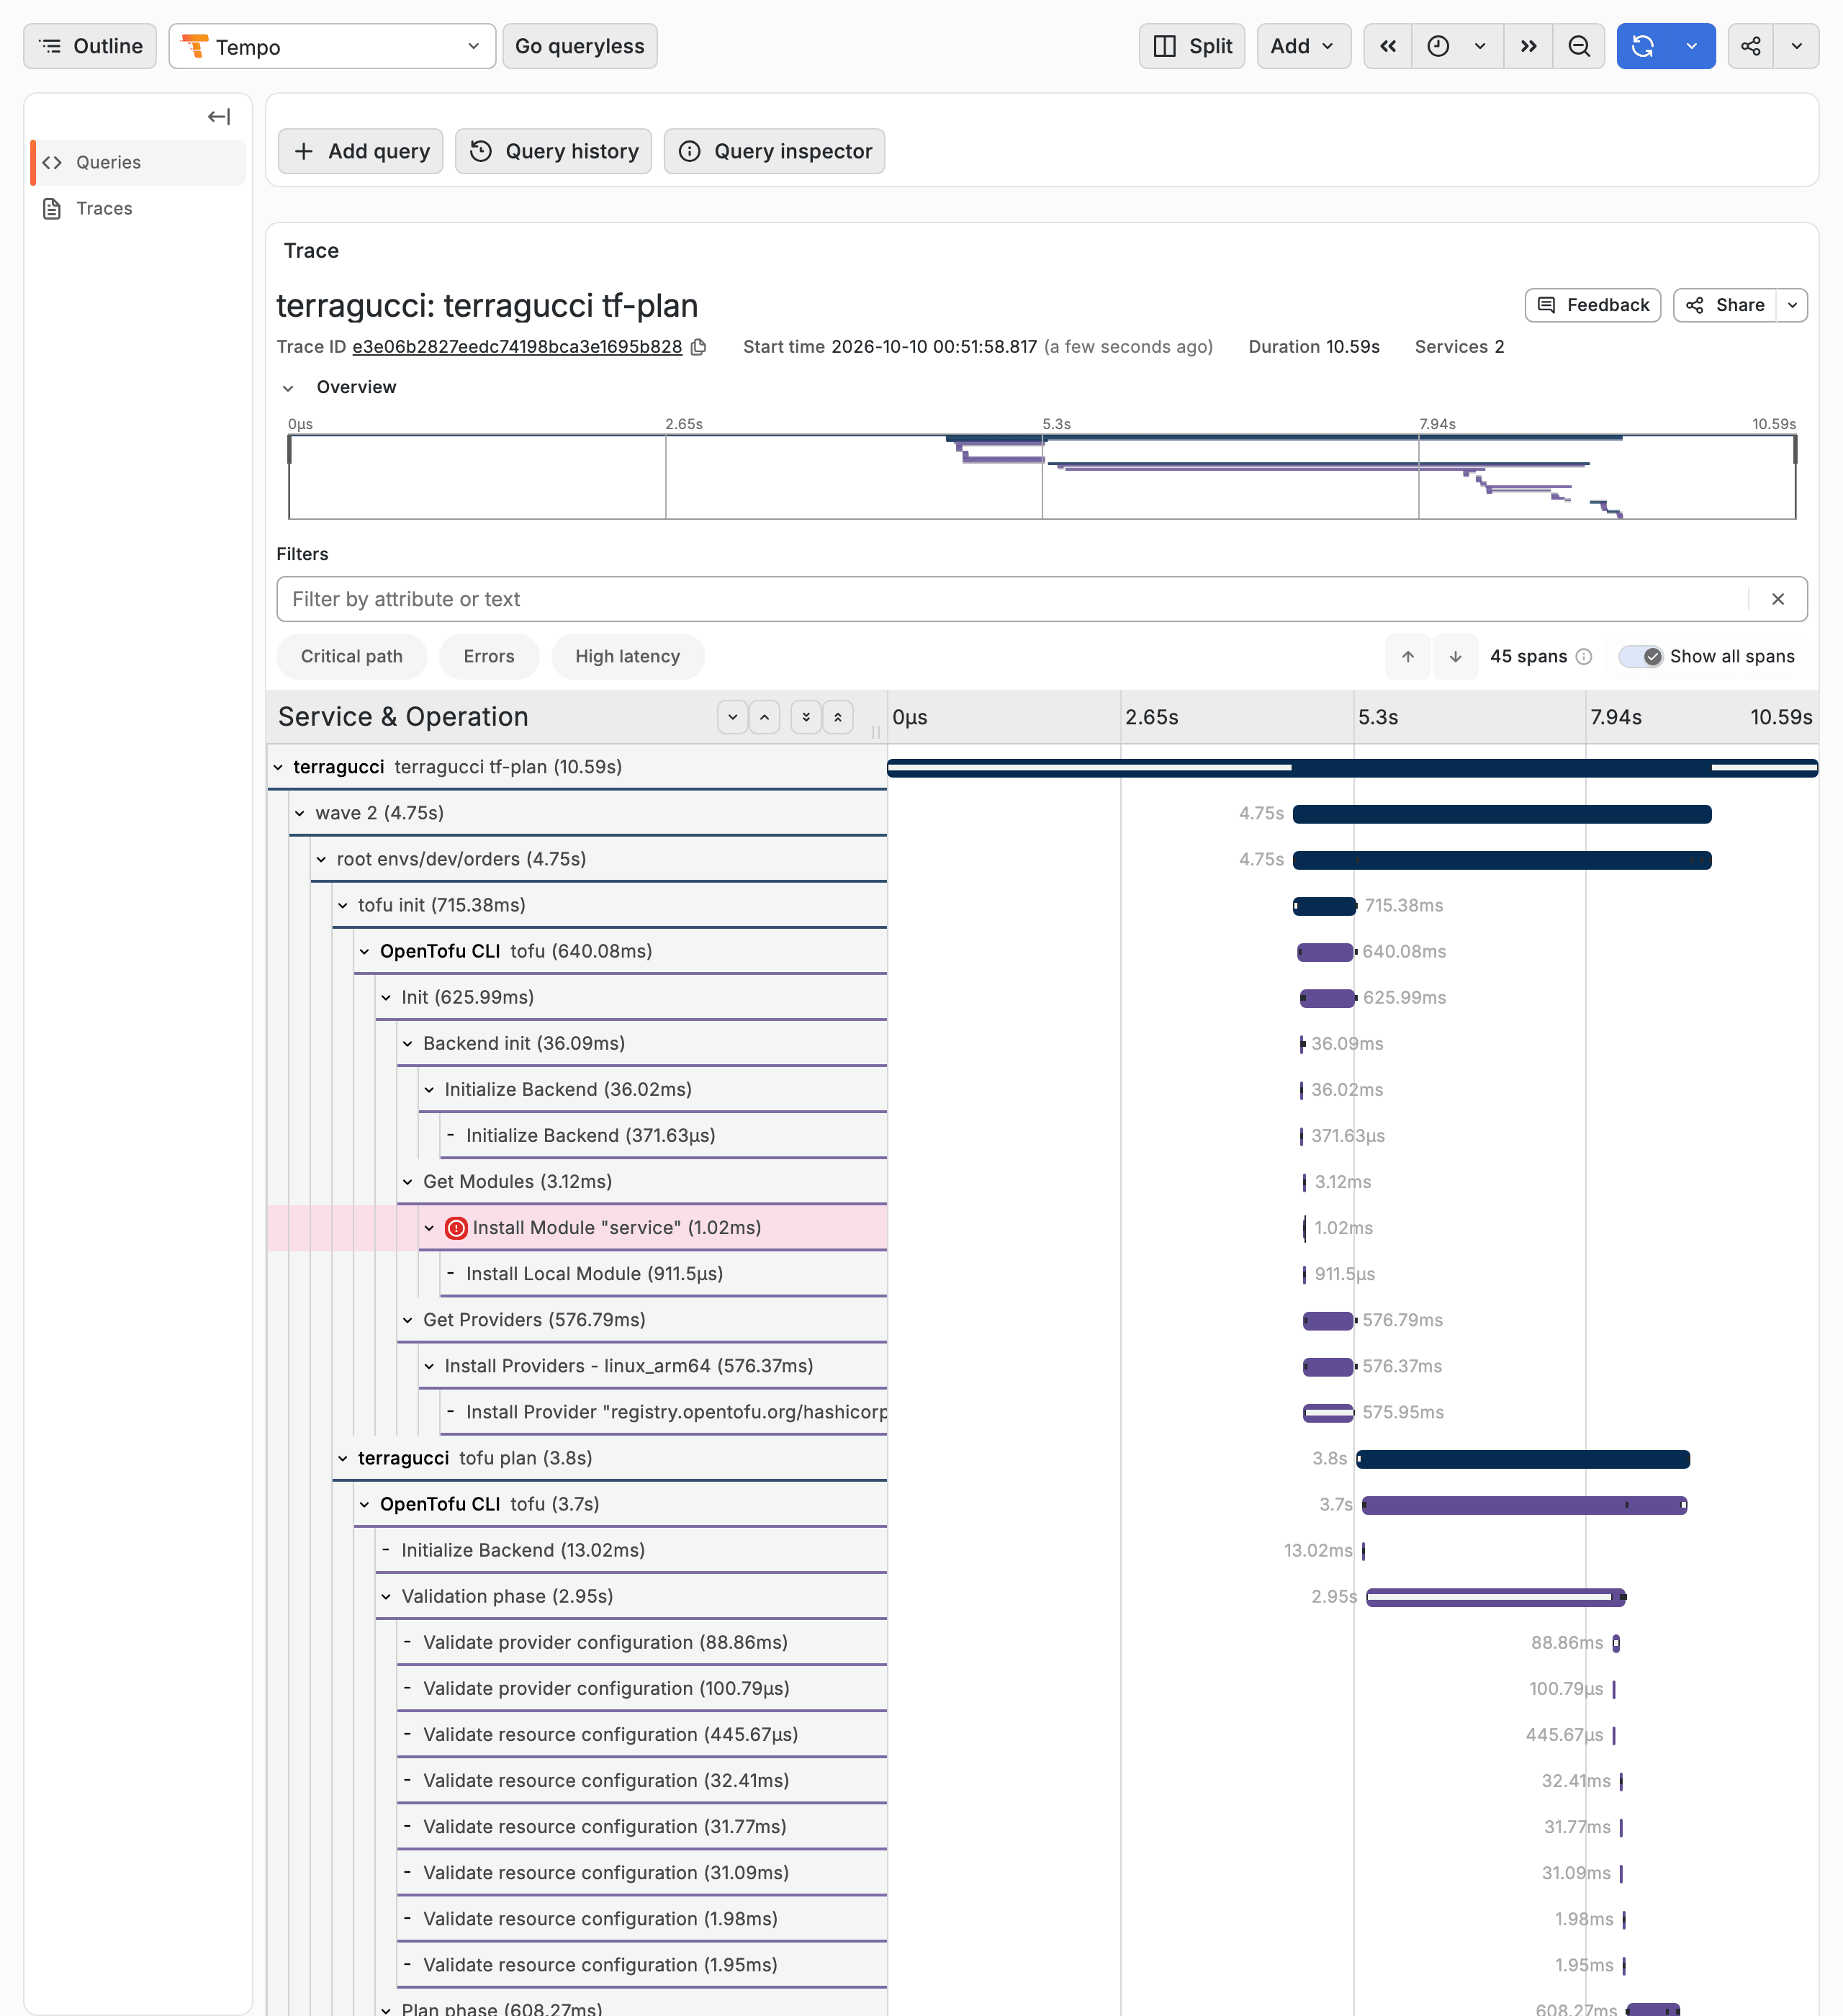
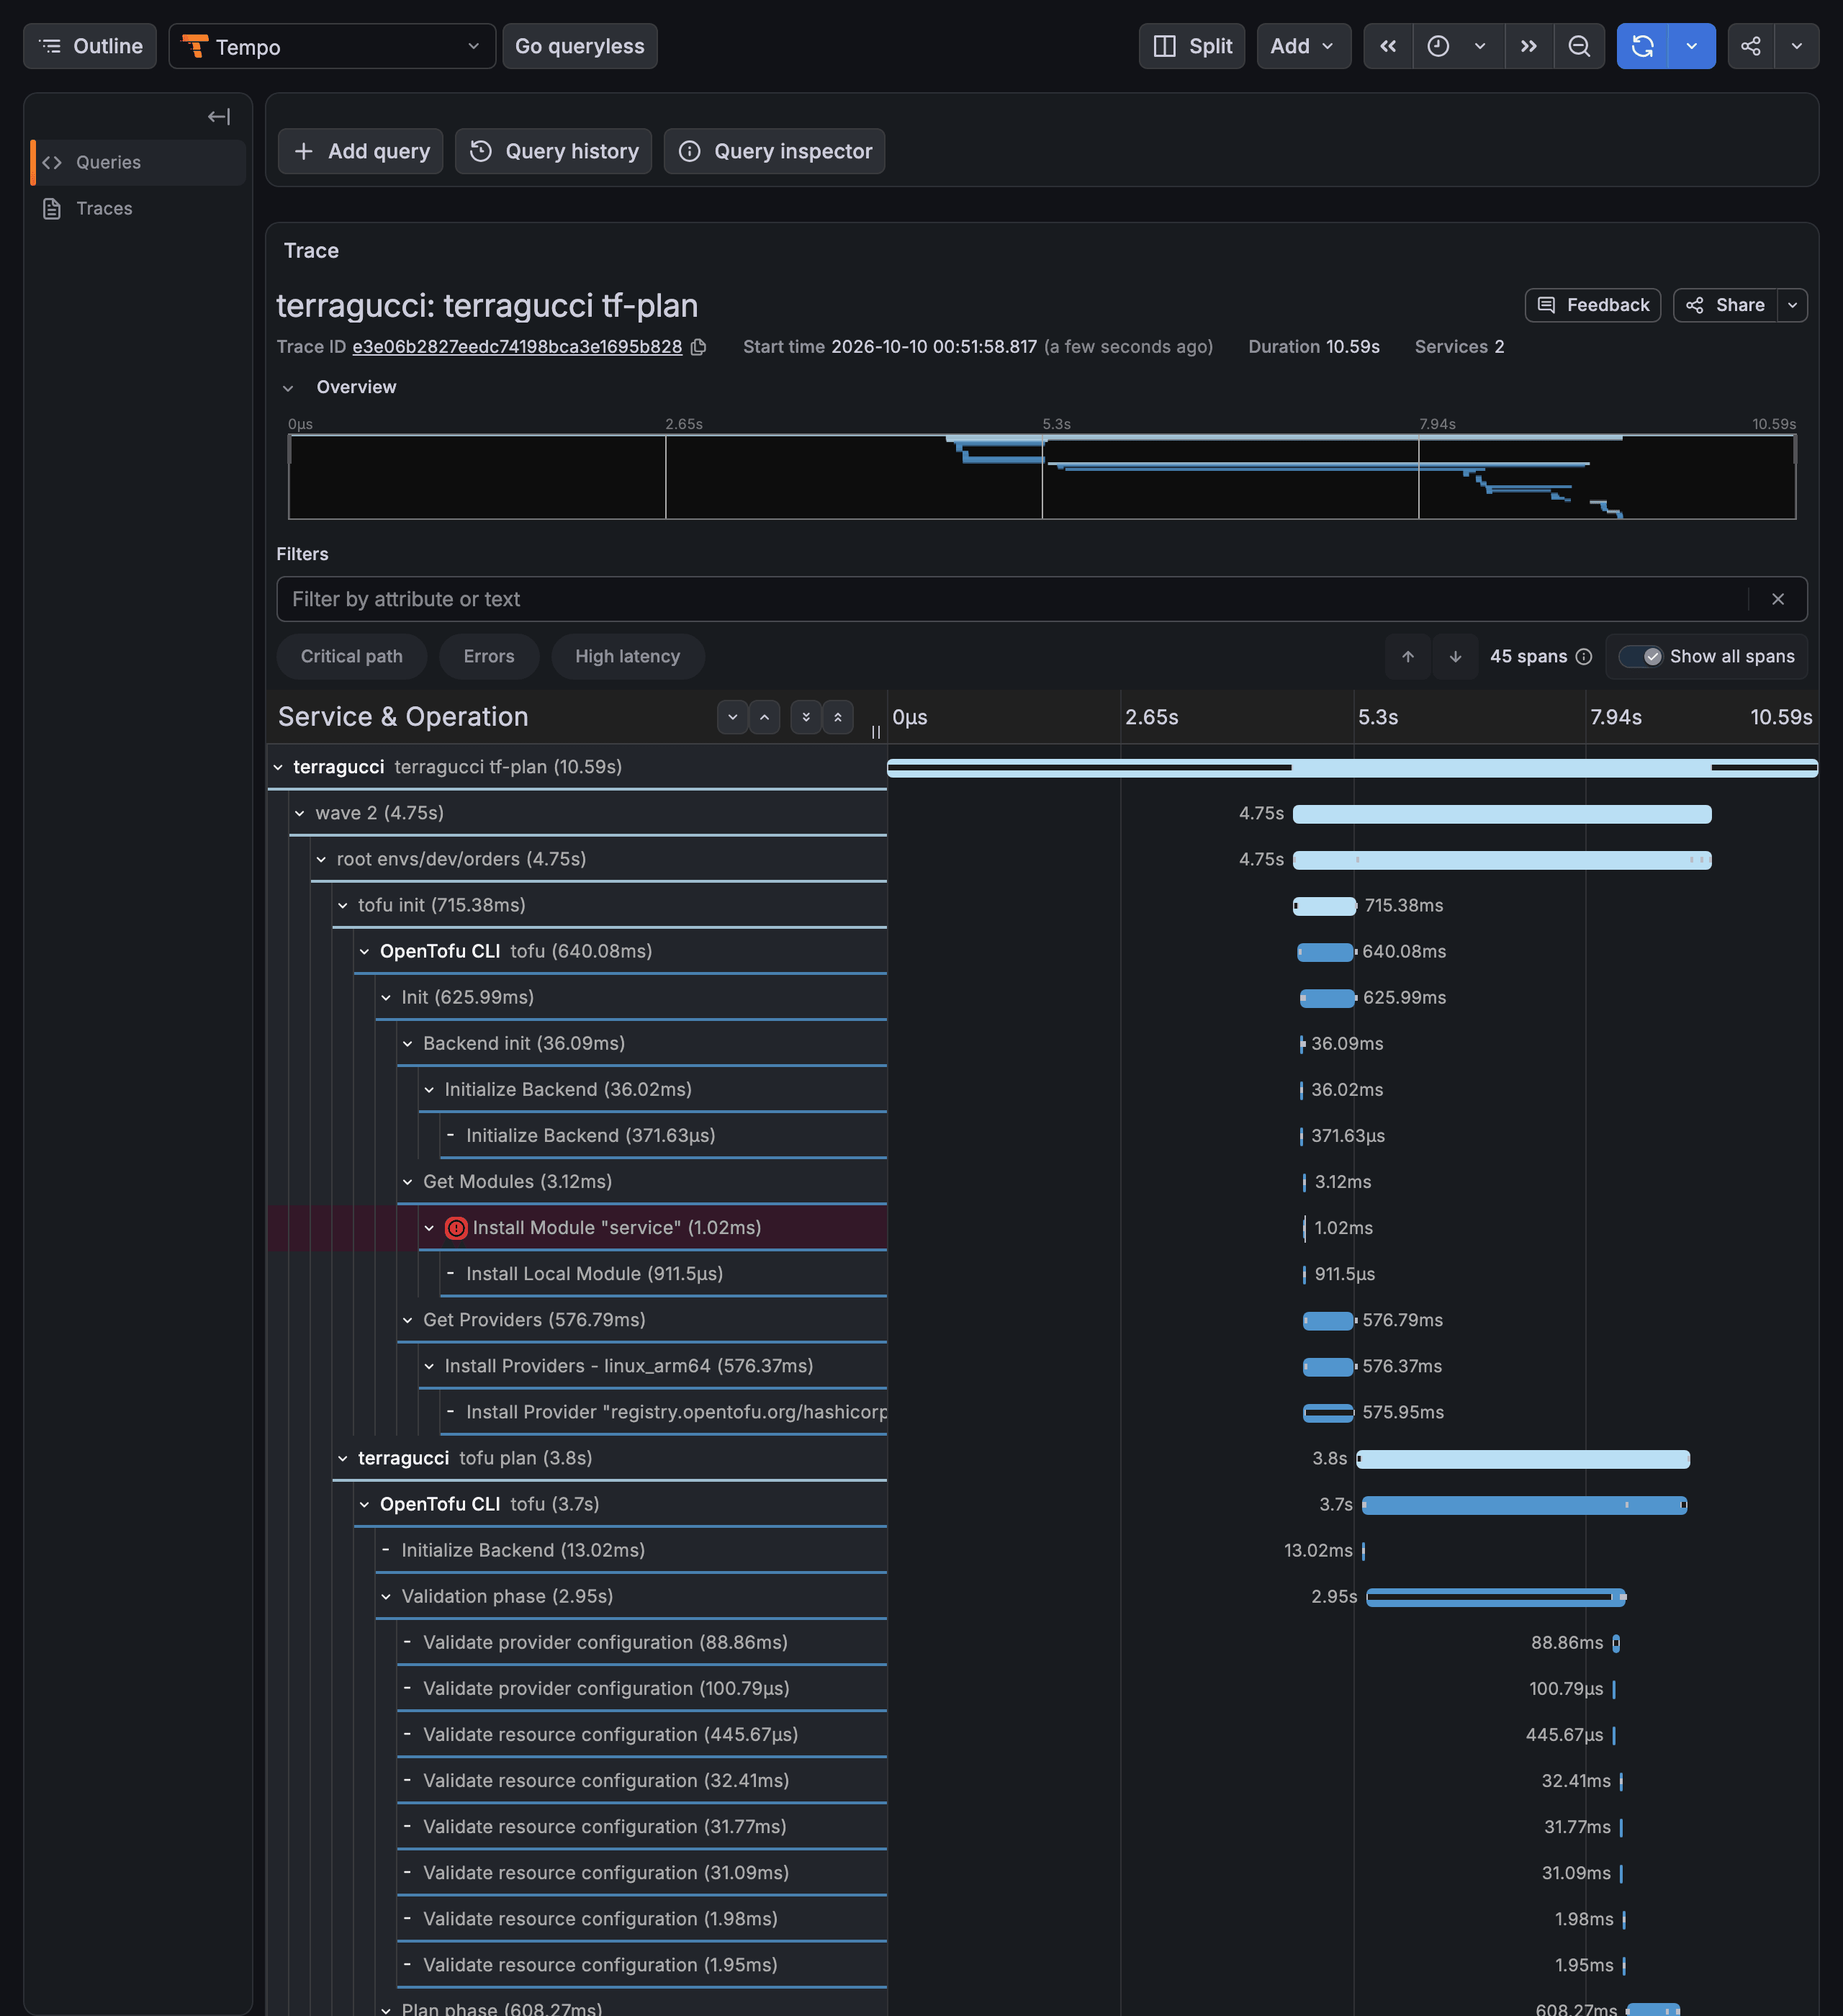
Check the next pull request that changes a root. Its plan job sends a trace with a span per root and the binary’s spans inside it, and the Pipeline health and Change review dashboards show the run.
Dashboard requirements
Section titled “Dashboard requirements”| Dashboard | Fills in after |
|---|---|
| Pipeline health, Change review, Runs, Estate | a plan on a pull request |
| Estate’s Delivery panels | the scheduled estate job with OTEL_EXPORTER_OTLP_ENDPOINT set (See every project) |
| Drift | a scheduled drift run (Turn on drift checks) |
| Rollouts and waves | a wave on the default branch, or one that waits for an approval |
| The three SLO dashboards | the recording rules in Prometheus, and the span metrics connector |
- Traces and metrics lists every span, metric, label and alert.
- Keep reports in a bucket gives the dashboards’ report links somewhere to go.

These docs count page views and clicks with PostHog. They set no cookies, store nothing in your browser, and send nothing when your browser asks not to be tracked.