
See your runs
 Optional: hand this page to your coding agentThe steps work by hand too.
Show the whole prompt
Read https://intentius.io/terragucci/tutorial/see-your-runs/.
In the terragucci clone with the example booted, run `just see-runs` and tell me what the Pipeline health, Rollouts and waves, Drift and Runs dashboards in Grafana at http://localhost:3310 show, and where they differ from the page.
`just see-runs` runs the waves of a scratch copy of the example against floci only; that is the one exception to the line below.
Never apply, approve (a pull request review or `terragucci approve`), override a policy denial (`terragucci override`), use `--mode apply`, or merge; never touch `.chant/allowed_signers` or `chant/lifecycle`.Every stage can send traces and metrics to an OpenTelemetry collector. dashboards: true makes init write the Grafana dashboards and alert rules too. Send three runs of the example to Grafana:
just see-runs$ just see-runs
tf-plan: 15 roots planned, 3 groups (pull request 1)
tf-drift: 1 roots drifted
tf-apply wave 1: nothing to change, so nothing to approve
tf-apply wave 2: waits for an approval
Grafana shows the runs: forgejo:3000/terragucci-admin/example
The dashboards, in Grafana at http://localhost:3310 (folder terragucci):
http://localhost:3310/d/terragucci-pipeline-health
http://localhost:3310/d/terragucci-change-review
http://localhost:3310/d/terragucci-rollouts-waves
http://localhost:3310/d/terragucci-drift
http://localhost:3310/d/terragucci-estate
http://localhost:3310/d/terragucci-runs
http://localhost:3310/d/slo-terragucci-plan-timeIt runs three stages on a copy of the example, with OTEL_EXPORTER_OTLP_ENDPOINT set:
| Stage | Run | Result |
|---|---|---|
tf-plan |
the module-bump change | success |
tf-drift |
after deleting staging orders’ jobs queue from floci, as on the Drift page | success |
tf-apply |
the waves, with the gate set to always |
wave 1 has nothing to change and passes; wave 2 waits for an approval |
The ledger goes to a scratch repo, so the Forgejo example stays as it was.
The dashboards are in the terragucci folder of Grafana at localhost:3310. The picture below shows the minutes the runs took.
Pipeline health
Section titled “Pipeline health”Each stage run is one span counted by stage and outcome. The plan and drift runs count as successes and the waves as nothing and waiting, which are not errors.
Rollouts and waves
Section titled “Rollouts and waves”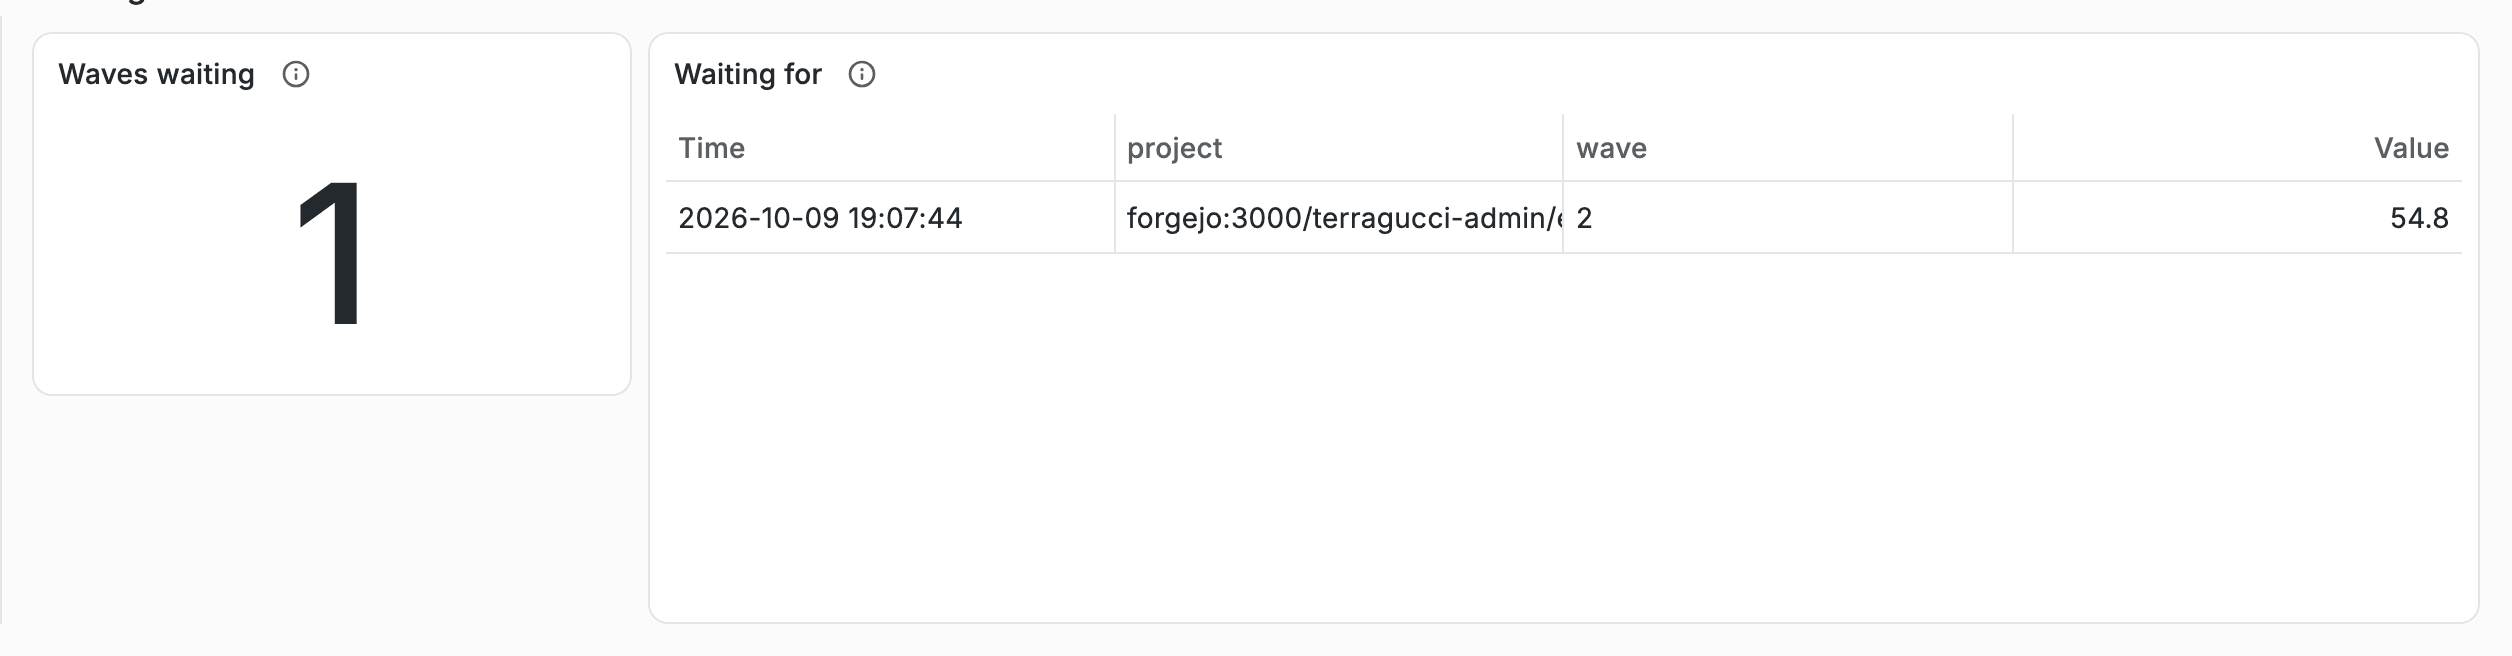
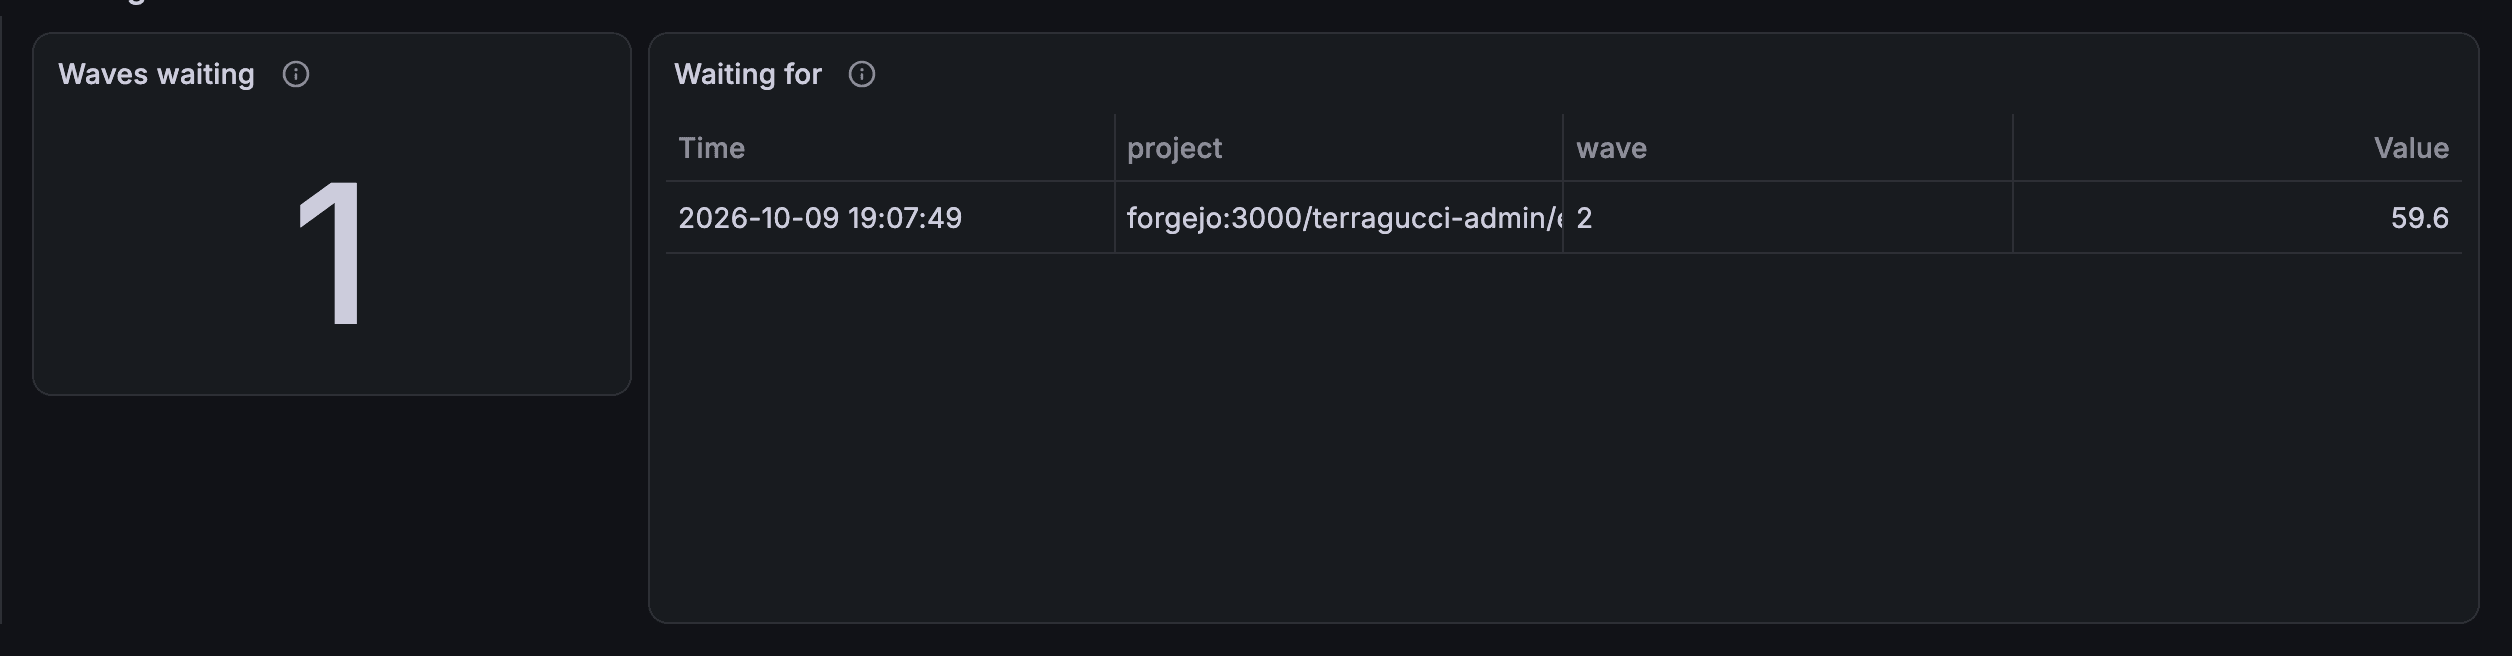
No wave was refused or failed. Past wave_wait (four hours by default), a waiting wave fires TerragucciWaveWaiting.
The tf-drift run finds the deleted queue in staging orders, and floci’s missing tags on every root. TerragucciDriftOld fires once the drift is older than drift_age (a day).
The table at the bottom lists each run’s trace; opening one shows OpenTofu’s spans inside each root.
Traces and metrics lists every dashboard, the alert rules and the collector settings.
In your own repo
Section titled “In your own repo”Add the key and run init:
dashboards: true
env:
  OTEL_EXPORTER_OTLP_ENDPOINT: https://otel-collector.example.com:4318
init writes the dashboards under observability/terragucci/. Point Grafana and Prometheus at that directory, and give your collector the spanmetrics connector.
Tutorial step 9 of 11.

These docs count page views and clicks with PostHog. They set no cookies, store nothing in your browser, and send nothing when your browser asks not to be tracked.