
Traces and metrics
 Optional: hand this page to your coding agentThe steps work by hand too.
Show the whole prompt
Read https://intentius.io/terragucci/reference/observability/.
Add the OTLP variables and `dashboards: true` to terragucci.yml as the page says, run `npx terragucci init`, and open a pull request. List the secrets I must add; do not create them.
Never apply, approve (a pull request review or `terragucci approve`), override a policy denial (`terragucci override`), use `--mode apply`, or merge; never touch `.chant/allowed_signers` or `chant/lifecycle`.Nothing is sent until an endpoint is set; any backend with an OTLP endpoint works.
Turning it on
Section titled “Turning it on”terragucci reads the standard OpenTelemetry variables. Set the endpoint for every job in terragucci.yml:
env:
  OTEL_EXPORTER_OTLP_ENDPOINT: https://otel-collector.example.com:4318
Variables
Section titled “Variables”| Variable | Effect |
|---|---|
OTEL_EXPORTER_OTLP_ENDPOINT |
the collector’s OTLP/HTTP base URL; traces go to /v1/traces and metrics to /v1/metrics |
OTEL_EXPORTER_OTLP_TRACES_ENDPOINT, OTEL_EXPORTER_OTLP_METRICS_ENDPOINT |
one signal’s full URL, used as given |
OTEL_EXPORTER_OTLP_HEADERS |
key=value pairs sent with every request, such as an API key |
OTEL_TRACES_EXPORTER=none, OTEL_METRICS_EXPORTER=none |
turn one signal off |
OTEL_SDK_DISABLED=true |
turn both off |
OTEL_SERVICE_NAME, OTEL_RESOURCE_ATTRIBUTES |
the service name (default terragucci) and extra resource attributes |
TRACEPARENT |
the stage’s trace joins this one, when your CI starts a trace of its own |
Headers and secrets
Section titled “Headers and secrets”| Setting | Value |
|---|---|
| protocol | OTLP/JSON over HTTP, so the collector’s port 4318, not gRPC |
| keys | a CI secret named by telemetry: { headers_secret: OTLP_HEADERS }; the generated workflows set OTEL_EXPORTER_OTLP_HEADERS from it on the plan, apply and drift jobs |
| a fork’s pull request | gets no secrets |
| GitLab | mark the variable masked |
| an unreachable collector | never fails a stage |
The trace
Section titled “The trace”terragucci tf-plan project, commit, binary, change set, totals
wave 2 set digest, approval
root envs/prod/payments plan digest, changes by action, status
tofu init
tofu plan the binary's own spans, under this one
tofu showSpans from the binary
Section titled “Spans from the binary”Each binary run is a span, passed as TRACEPARENT. OpenTofu and choudoufu nest theirs in it; Terraform starts its own, tagged terragucci.trace_id, terragucci.span_id and terragucci.root.
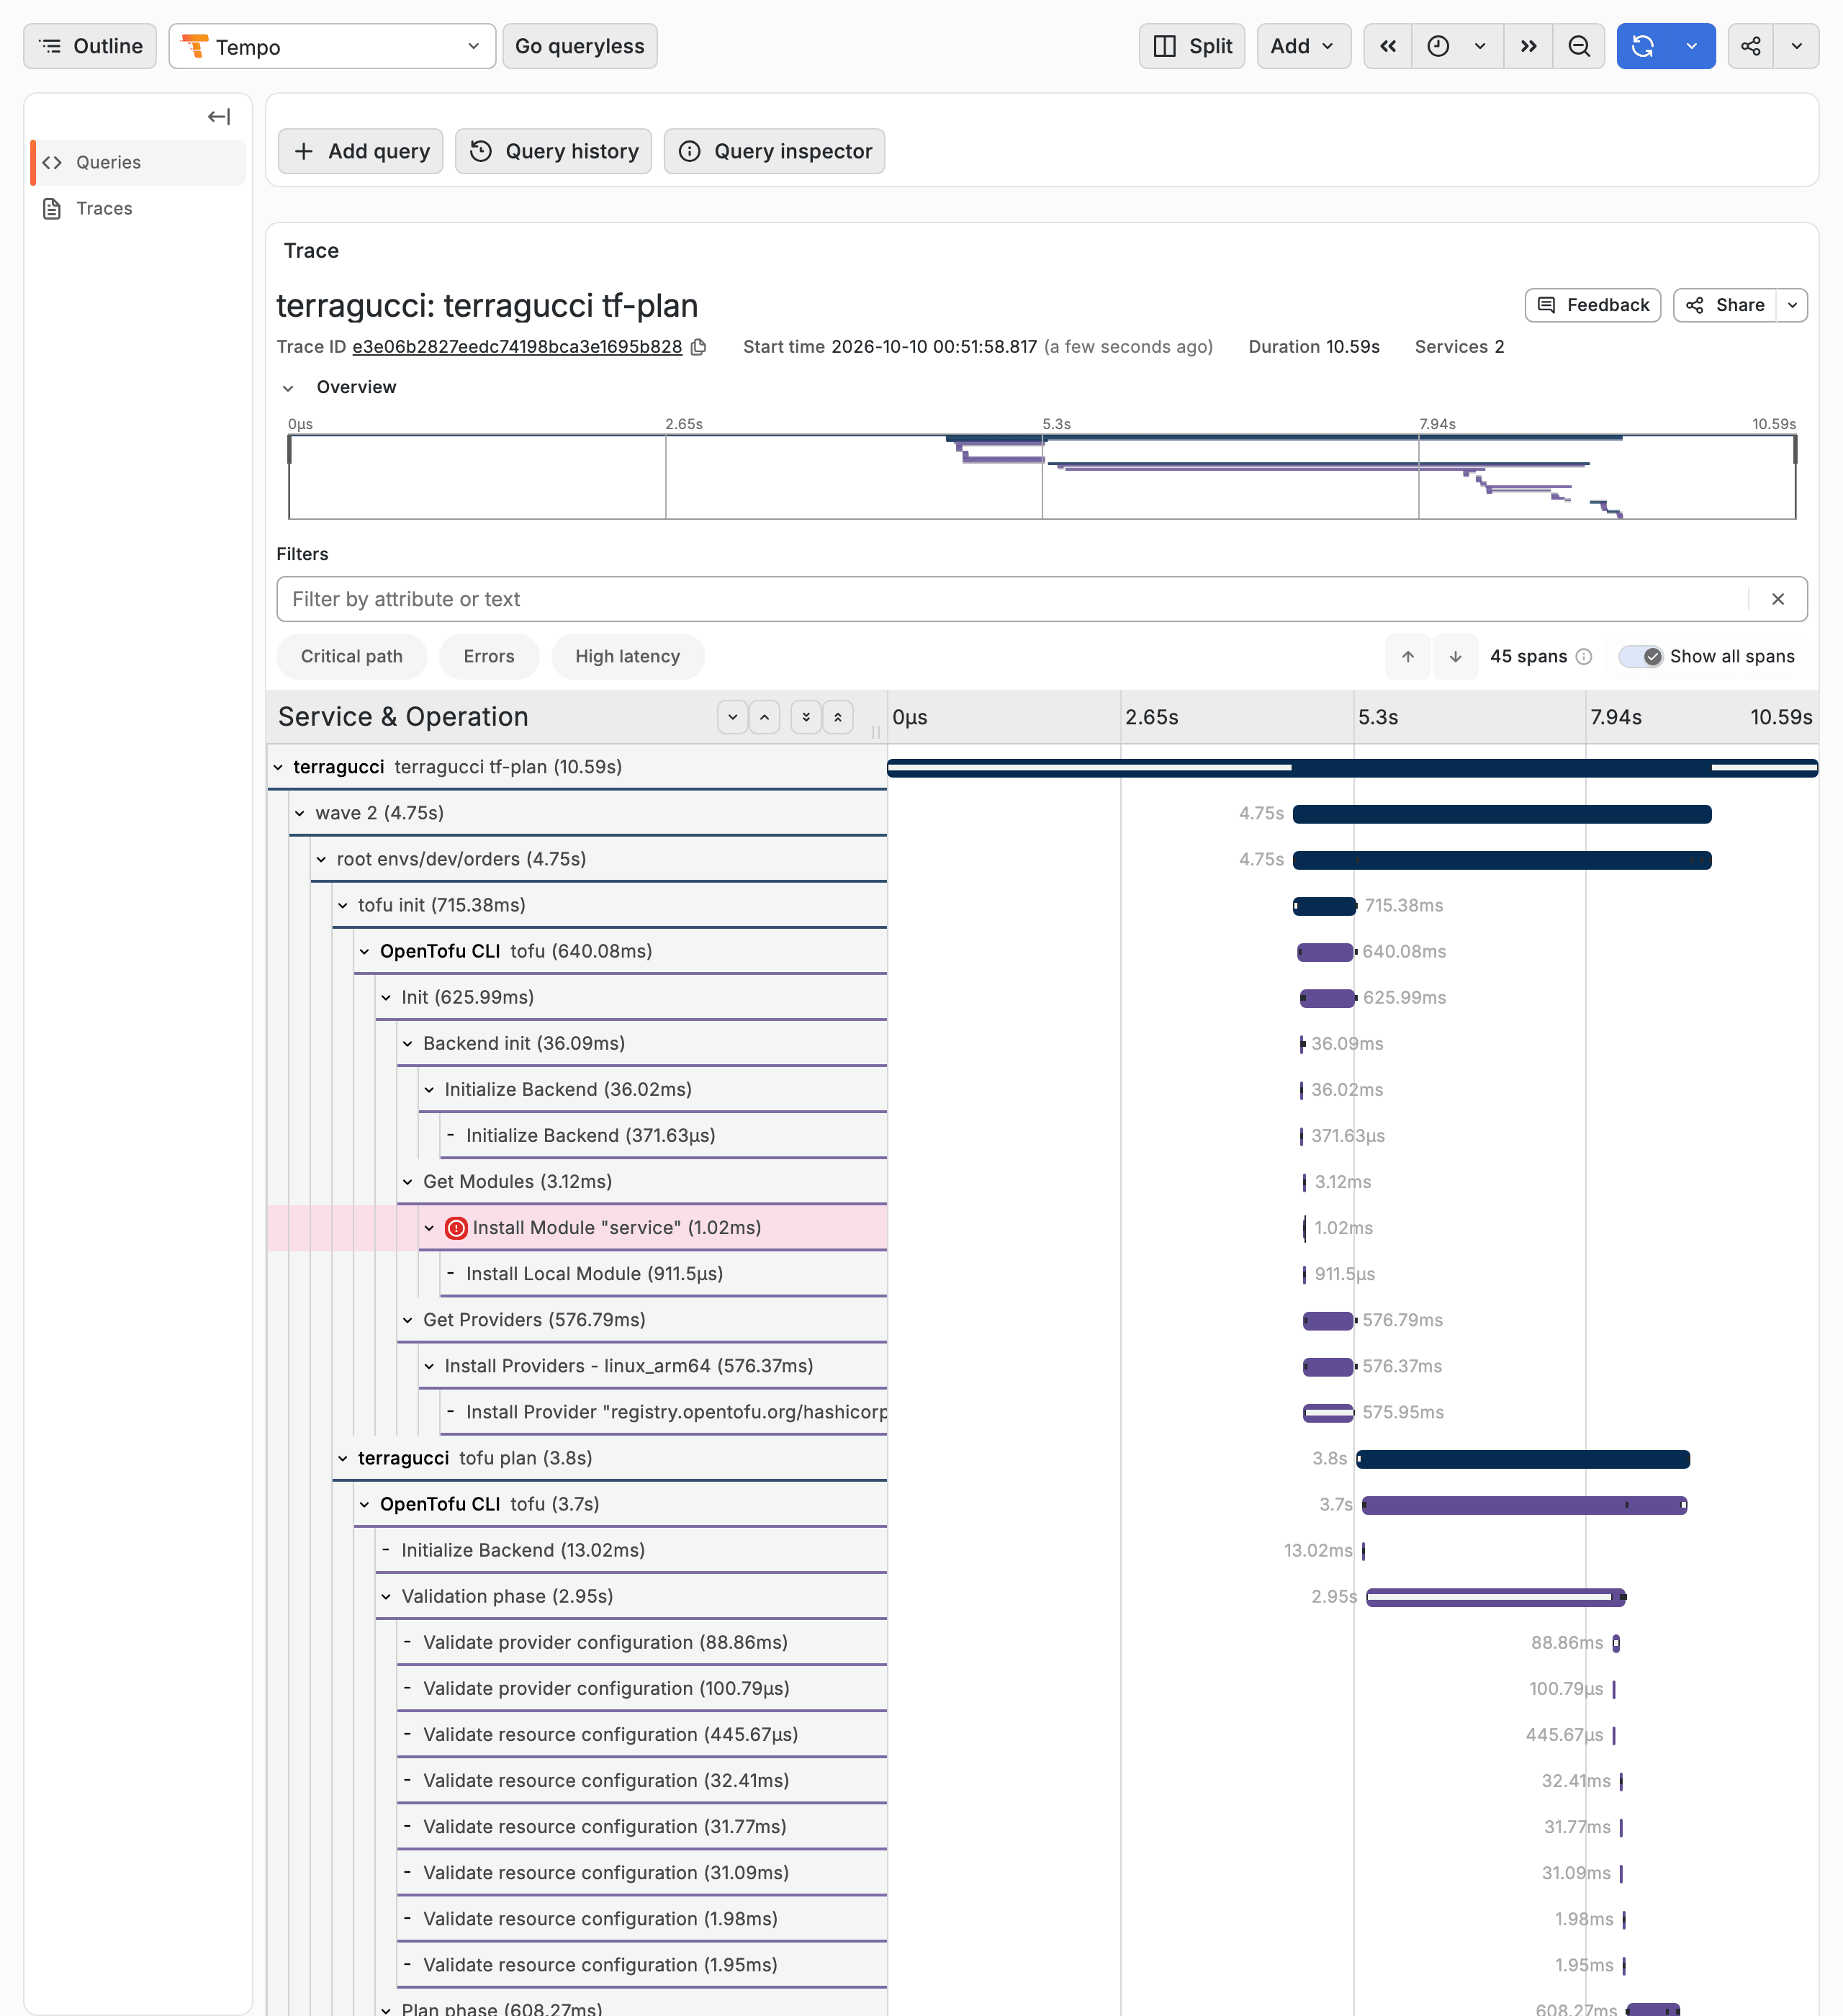
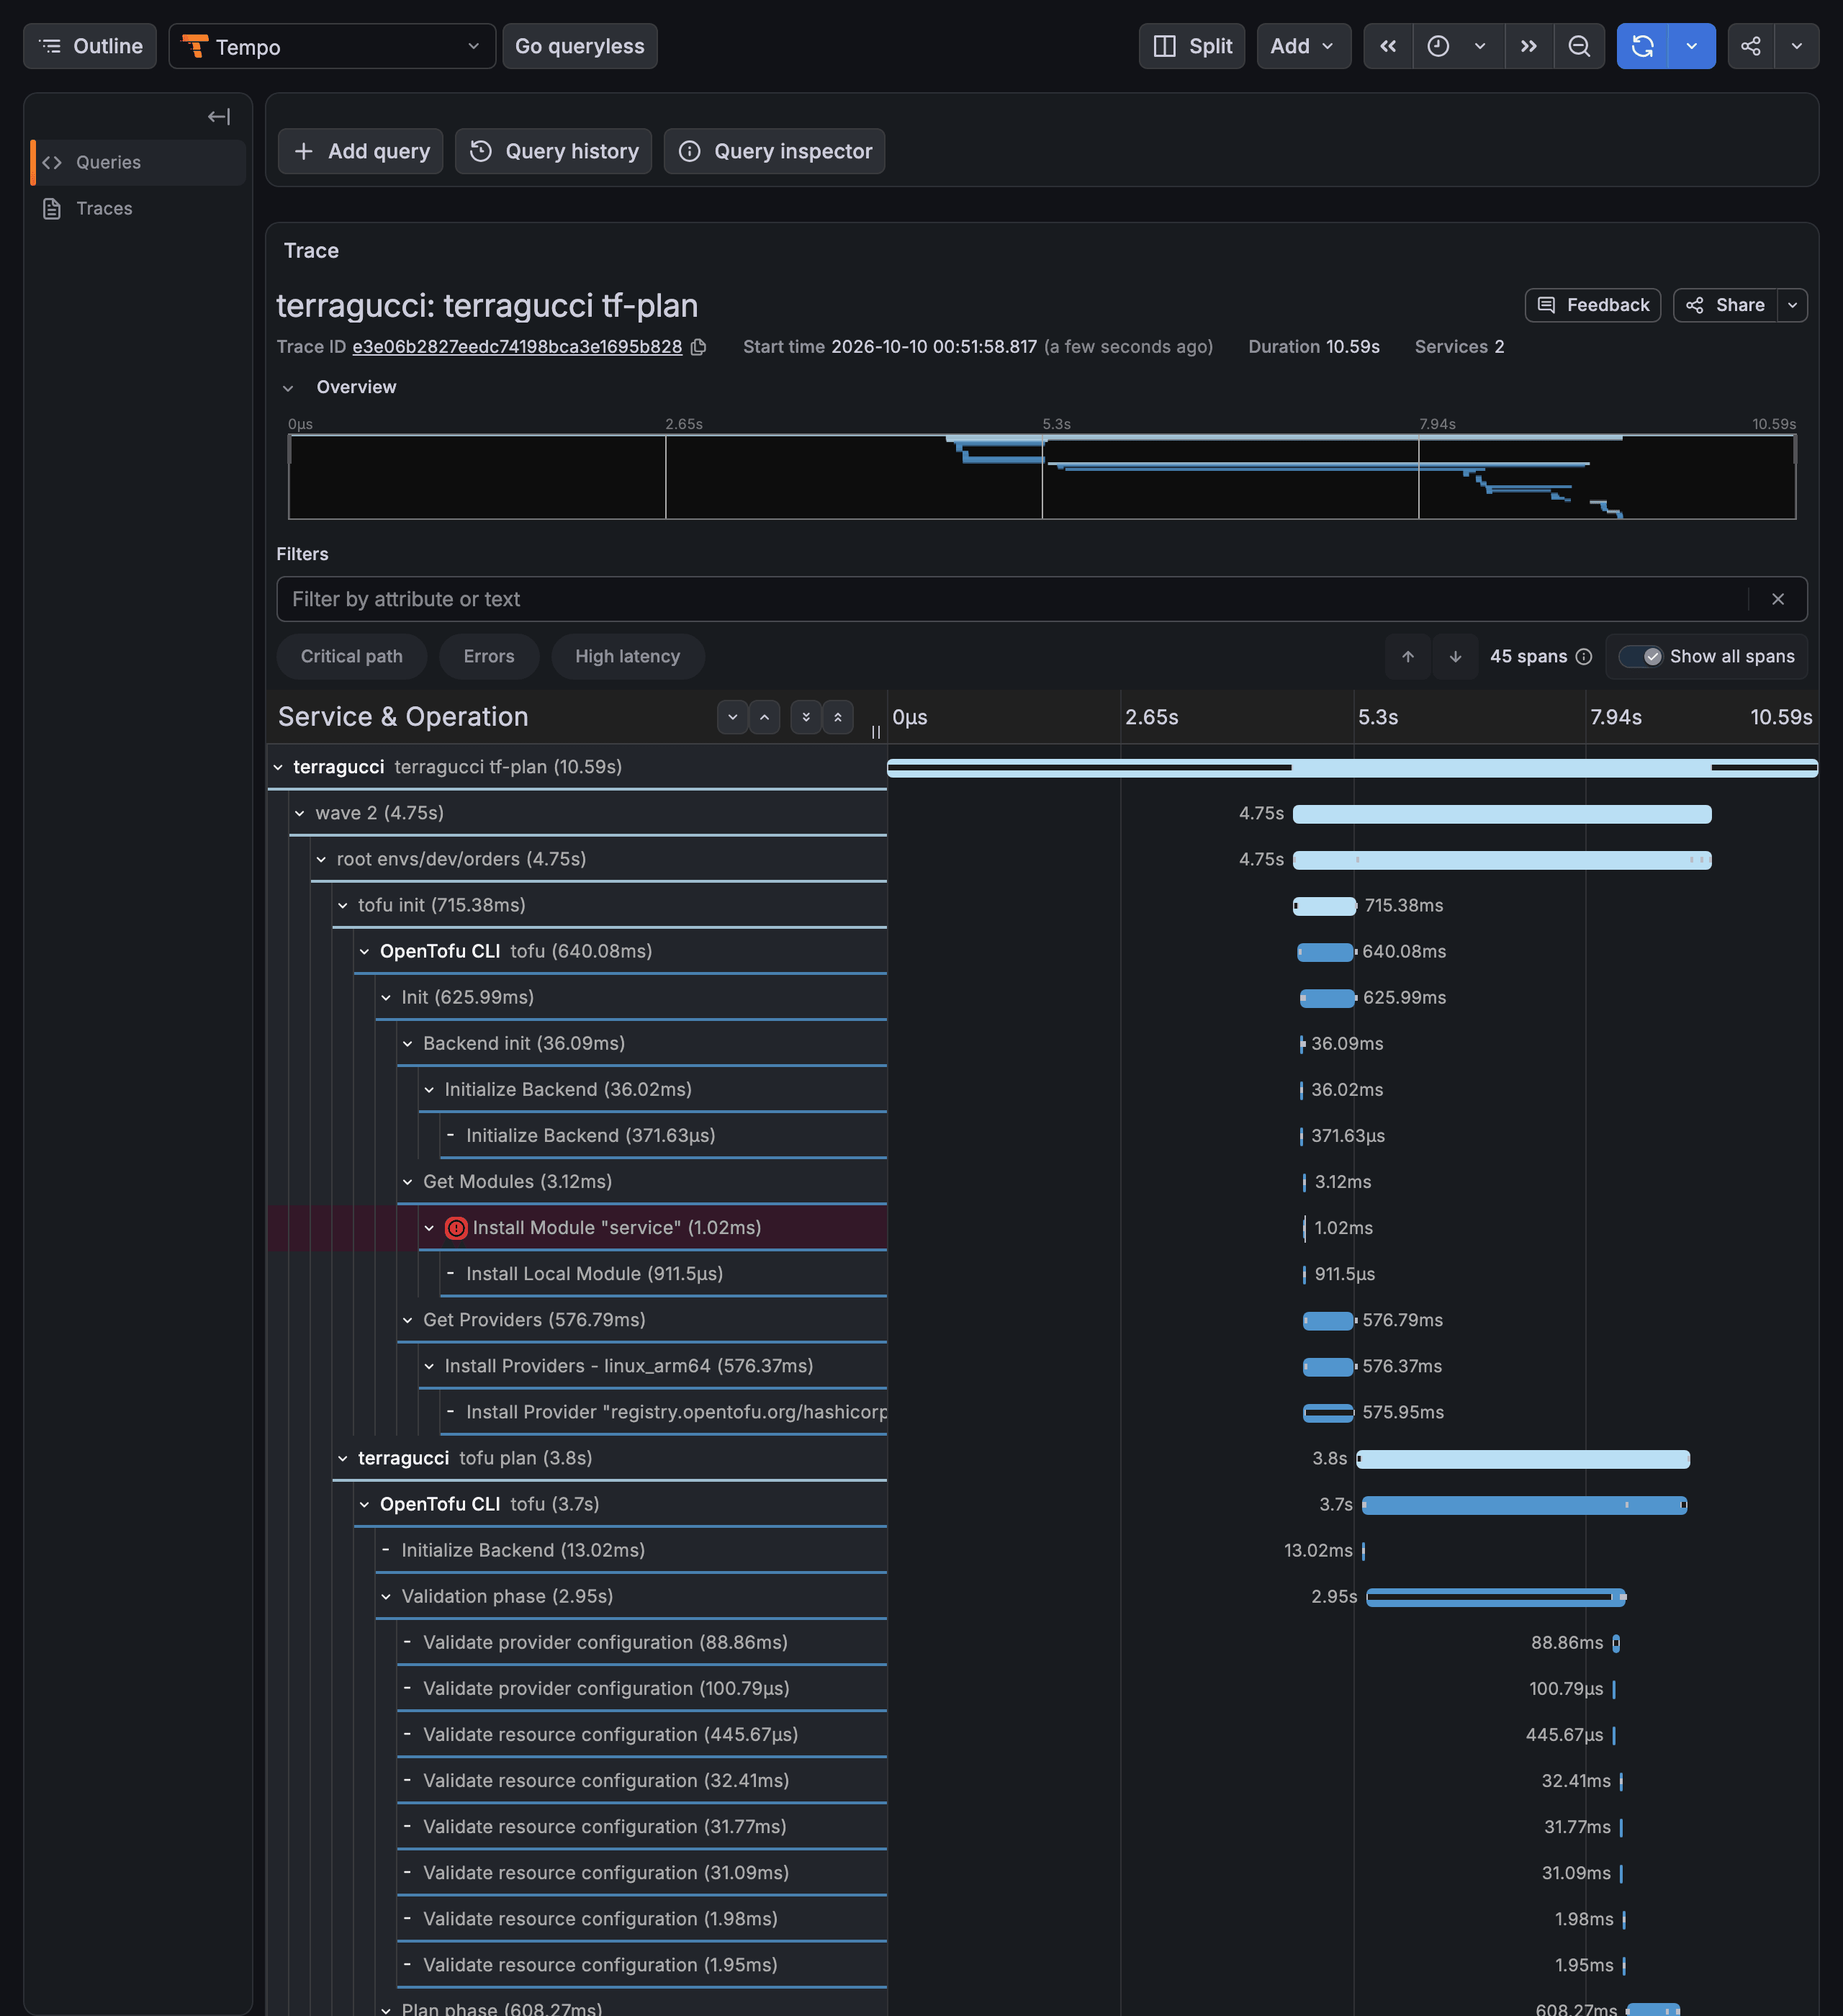
The binary exports to a loopback receiver, OTLP over HTTP only, which forwards batches to your collector.
Timings
Section titled “Timings”With binary: choudoufu, the OpenTofu fork from the team behind terragucci (set it up), the report also times each provider call, sums timings by resource type on a large estate, and times every state lock wait.
Report contents
Section titled “Report contents”Each plan, drift and wave report lists where the time went, even without an endpoint:
- roots by wall time, slowest first, with each one’s plan time and, in a wave, its apply time;
- the slowest resource instances in each root, with their refresh time;
- the time of each provider call, with the resource it was for;
- provider start-up;
- waits for a state lock, from choudoufu on a backend that locks.
Past a span budget (CHOUDOUFU_TRACE_DETAIL, CHOUDOUFU_TRACE_SPAN_BUDGET) choudoufu sums timings by resource type or provider method, and the report says so.
choudoufu adds two more:
| Timing | Sent by | Spans | In report.json |
|---|---|---|---|
| provider calls | choudoufu | tfplugin5.Provider/<method> and tfplugin6.Provider/<method>, with rpc.method |
roots[].timings.provider_calls |
| summed timings | choudoufu, once a walk passes its span budget (2000 by default) | Aggregate: <span name> |
roots[].timings.aggregates |
Timings by binary
Section titled “Timings by binary”| Binary | What the report gets |
|---|---|
| Terraform | no traces; the report says so |
| OpenTofu | a span for each resource instance it plans or applies, so the report lists the slowest resources |
| choudoufu | what OpenTofu gives, plus provider calls, summed timings past the span budget, and state lock waits |
| Terragrunt | a unit’s time from Terragrunt’s run report; a TG_TF_PATH wrapper points each plan at the receiver |
State lock waits
Section titled “State lock waits”On a root whose backend locks (S3 with use_lockfile, say), choudoufu (set it up) records each wait as a State lock wait span with its attempts. It shows in the report and in terragucci_lock_wait_seconds. An estate with a record store takes no lock, so it shows no waits (locking with choudoufu).
| Run | State lock wait |
|---|---|
| a Terragrunt plan | up to five minutes (-lock-timeout=5m) |
a tf-apply wave’s plan and apply |
up to five minutes (-lock-timeout=5m) |
TF_CLI_ARGS, TF_CLI_ARGS_plan or TF_CLI_ARGS_apply set a different wait. A wave writes its report to terragucci-report/ and the reports bucket when set.
The HTML report shows them under “Where the time went”, and report.json carries timings and roots[].timings; see Report JSON schema.
The metrics
Section titled “The metrics”Exported metrics
Section titled “Exported metrics”A stage pushes its metrics once, when it ends; point Prometheus exporter or remote write on your collector at them. A tf-apply wave sends terragucci_root_apply_seconds, terragucci_provider_init_seconds, terragucci_lock_wait_seconds and the terragucci_wave_* gauges. All are gauges with project and stage labels, plus those below.
Metric table
Section titled “Metric table”| Metric | Labels | Answers | Series per project and stage |
|---|---|---|---|
terragucci_stage_duration_seconds |
result |
how long each stage takes, and whether it failed | one per stage and result |
terragucci_roots_planned |
how many roots a change touches | one | |
terragucci_root_plan_seconds |
root |
the slowest roots | one per root |
terragucci_root_apply_seconds |
root, wave |
the slowest root applies; sent by a tf-apply wave |
one per root and wave |
terragucci_plan_changes |
action |
creates, updates, replaces and deletes, over time | one per action |
terragucci_plan_groups |
how far a change folds | one | |
terragucci_binary_version |
binary, version |
the binary versions in use across repos | one per binary version in use |
terragucci_last_run_seconds |
when each stage last ran, in Unix seconds | one | |
terragucci_roots_changed |
pull_request on a plan |
how many roots a pull request changes | one per pull request, which grows with every pull request |
terragucci_tips |
rule |
tips by rule | one per rule |
terragucci_module_pin |
root, module, version |
which version of each module each root pins | one per root, module and version, which grows with every version a root has pinned |
terragucci_provider_init_seconds |
root, provider |
provider start-up | one per root and provider |
terragucci_lock_wait_seconds |
root |
time spent waiting for a state lock | one per root that waited |
terragucci_resource_seconds |
root, address |
the run’s slowest resources | up to the ten slowest resources of a run, so the addresses change from run to run |
terragucci_drift_roots |
roots a drift run found drifted | one | |
terragucci_drift_since_seconds, terragucci_drift_clear_seconds |
when the open drift was first found (its drift issue opened), and when a drift run last found none | one each | |
terragucci_wave_roots |
wave |
roots in a tf-apply wave |
one per wave |
terragucci_wave_waiting_since_seconds, terragucci_wave_settled_seconds |
wave |
when a wave started waiting for its approval, and when it last stopped waiting | one per wave |
terragucci_dora_deployments_per_week, terragucci_dora_change_failure_ratio, terragucci_dora_restore_seconds |
project only, * for the estate; sent by terragucci estate |
the delivery metrics | one each per project |
terragucci_dora_lead_time_seconds |
project only, and segment; sent by terragucci estate |
the median lead time and its split | four per project |
Label cardinality
Section titled “Label cardinality”pull_request, address and version are unbounded, so a long-retention Prometheus grows with them. The Change review dashboard needs pull_request and the Runs dashboard needs address; dropping either empties those panels.
Run outcome
Section titled “Run outcome”The stage span’s terragucci.result is success or failure for a plan or drift run, and one of applied, nothing, waiting, refused and failed for a wave.
Resource attributes
Section titled “Resource attributes”Metrics carry only terragucci.project and service.version as resource attributes, and spans also carry vcs.ref.head.revision and cicd.pipeline.run.url.full.
Trace links
Section titled “Trace links”report.json records the run’s trace id as run.trace_id, and the HTML report shows it. Set telemetry.trace_url to a link with {trace_id} in it and the report links the trace instead:
telemetry:
  trace_url: "https://grafana.example.com/explore?left=%7B%22datasource%22:%22tempo%22,%22queries%22:%5B%7B%22query%22:%22{trace_id}%22%7D%5D%7D"
The stage span carries the run’s report.html address as terragucci.report.url when reports.url is set.
Dashboards and alerts
Section titled “Dashboards and alerts”Generated files
Section titled “Generated files”With dashboards: true, init and reconcile write Grafana dashboards and alert rules; init leaves files it did not write alone.
observability/terragucci/
  grafana/dashboards/<uid>.json                    one per dashboard
  grafana/provisioning/dashboards/terragucci.yaml  the provider that loads them
  grafana/provisioning/alerting/terragucci.yaml    the SLO burn-rate alerts, as Grafana-managed rules
  prometheus/terragucci.rules.yml                  the SLO recording rules and alerts, and the pipeline alerts
Dashboards
Section titled “Dashboards”init writes nine dashboards, the six below and one for each of the three SLOs.
| Dashboard | Shows |
|---|---|
| Pipeline health | runs per hour, errors and duration for each stage and project, and runs by result |
| Change review | roots changed and groups for each pull request, and creates, updates, replaces and destroys over time |
| Rollouts and waves | waves waiting for an approval and for how long, wave runs by result, and how many roots pin each module version |
| Drift | drifted roots by project, how old the open drift is, and roots corrected |
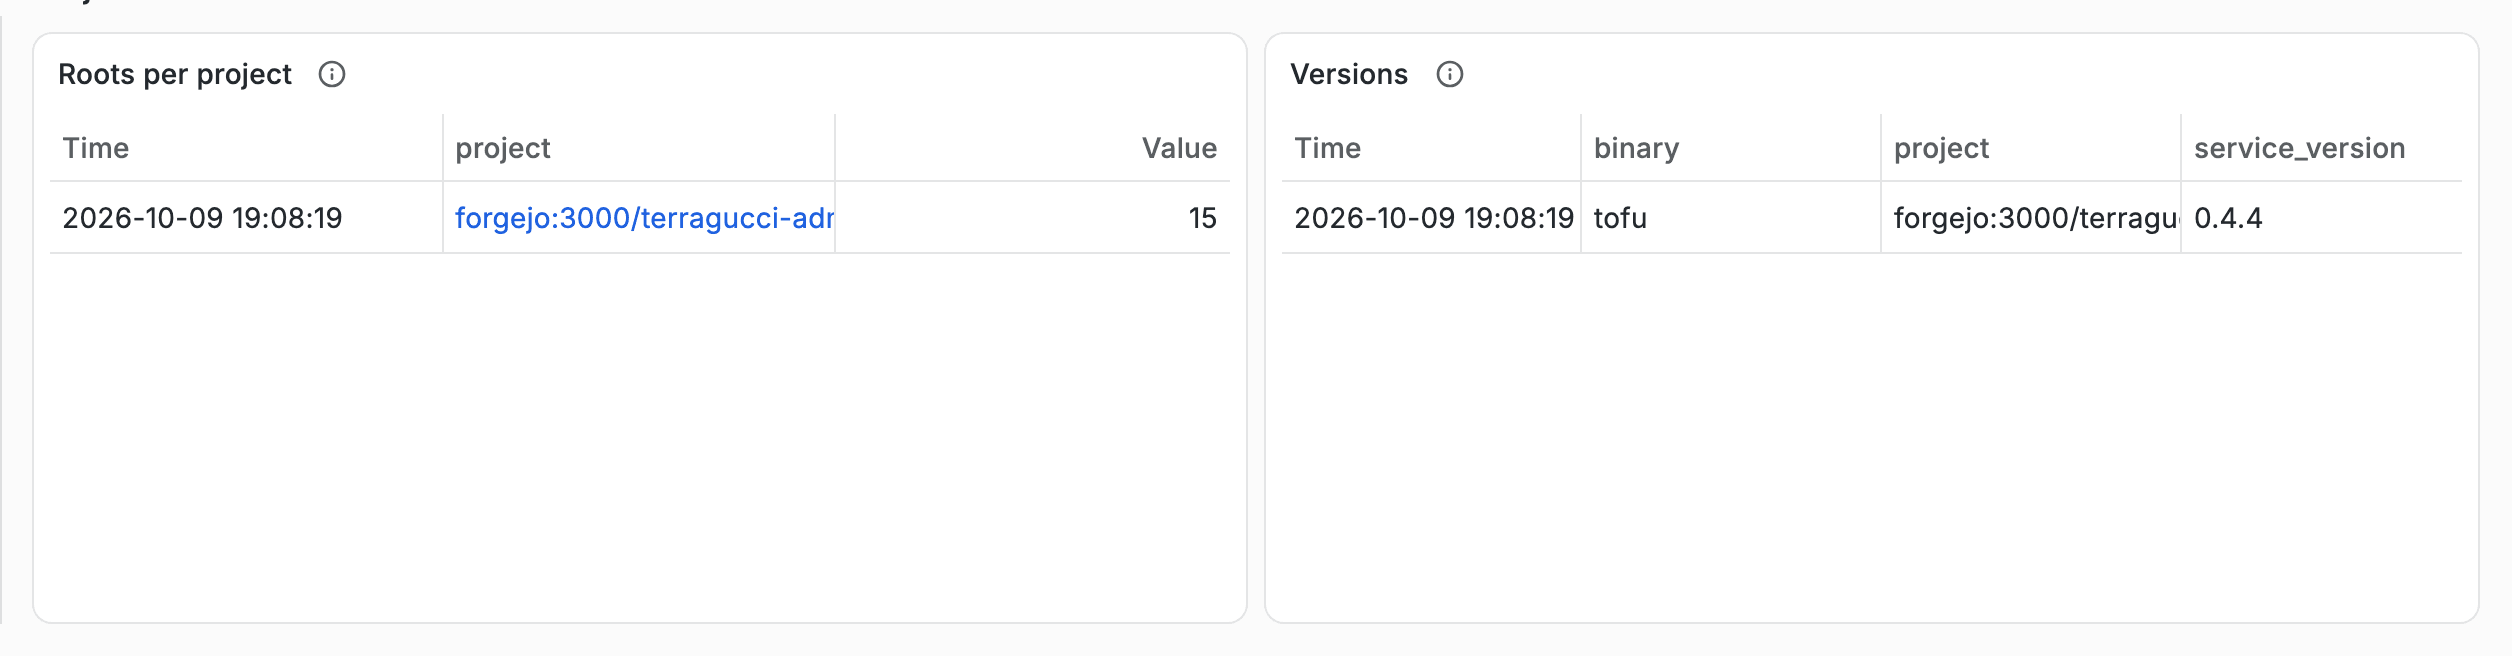
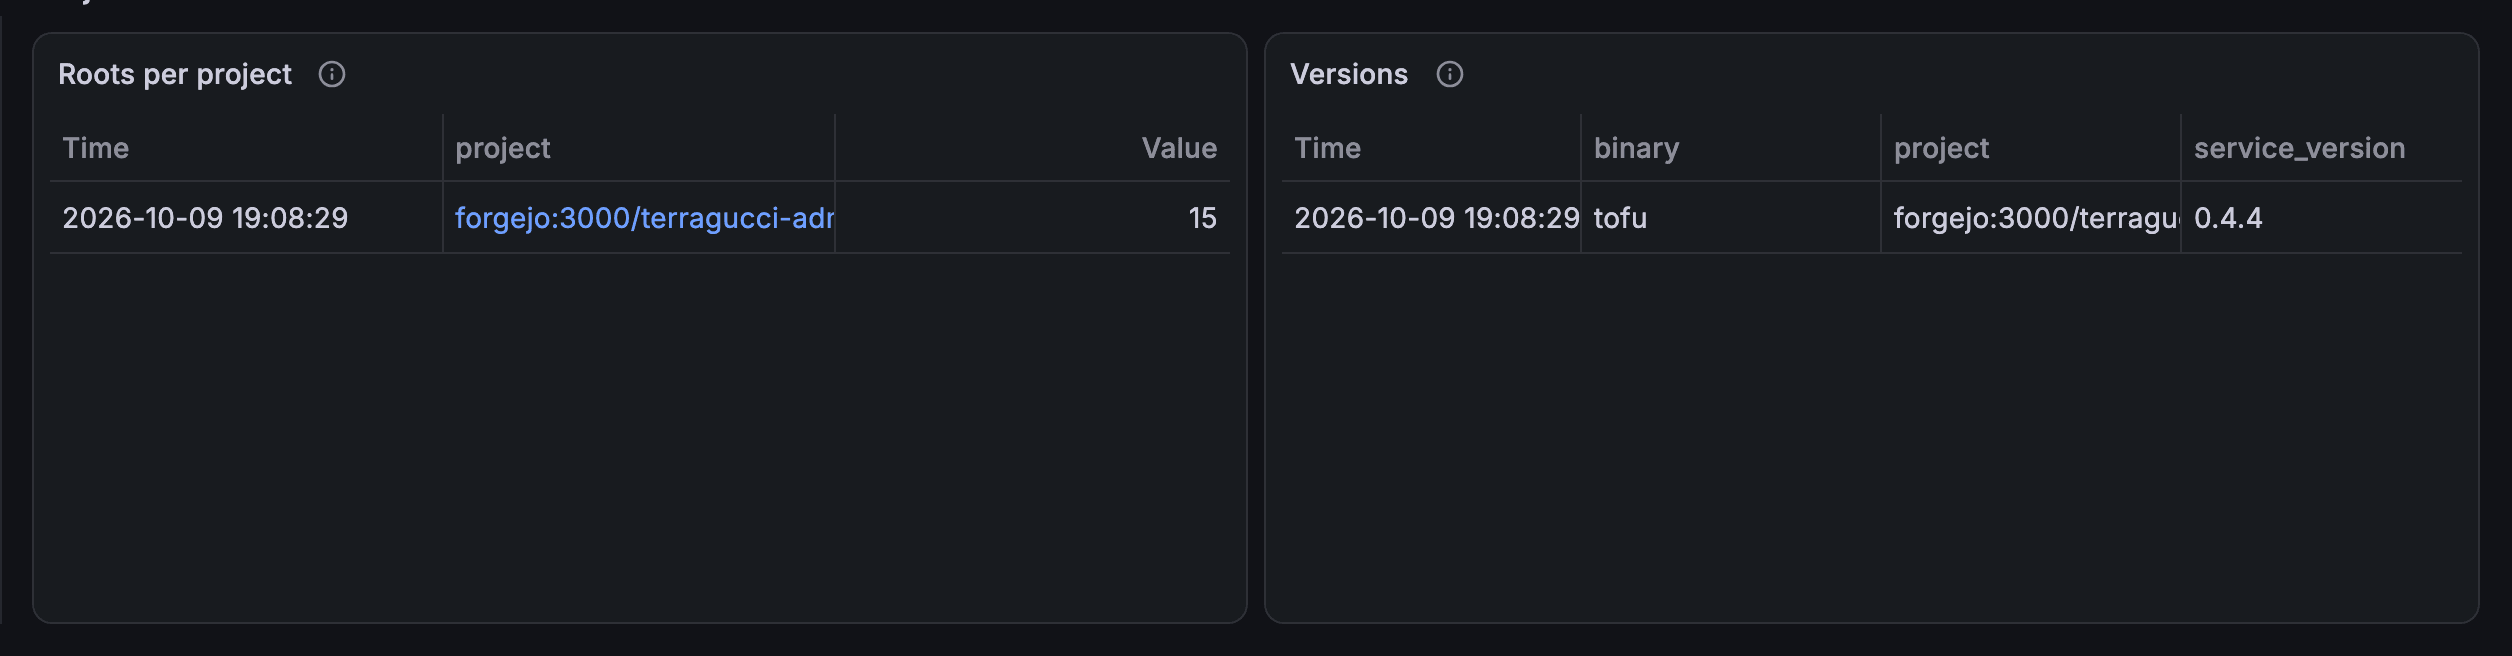
| Estate | roots per project, the binary and terragucci versions each runs, the delivery metrics terragucci estate sends, module pins and tips by rule |
| Runs | the slowest roots, root applies and resources, provider start-up, lock waits, stage durations, and the trace of each run from Tempo |
| One per SLO | the SLI against its objective, the error budget left and the burn rates |
SLOs and alerts
Section titled “SLOs and alerts”The SLOs, over 28 days: plans finish within ten minutes 95% of the time, wave applies succeed 99%, drift is corrected within a day 90%.


| Alert | Fires when |
|---|---|
TerragucciDriftOld |
a project’s open drift is older than drift_age |
TerragucciWaveWaiting |
a wave has waited for its approval longer than wave_wait |
TerragucciApplyFailed |
an apply failed in the last hour |
TerragucciWaveRefused |
a wave was refused in the last hour because its plans moved |
TerragucciDriftStopped |
a project’s drift run has not run for schedule |
Dashboard settings
Section titled “Dashboard settings”Key under dashboards |
Default | Meaning |
|---|---|---|
dir |
observability/terragucci |
where the files go |
prometheus |
prometheus |
the uid of the Grafana datasource reading the Prometheus that holds the metrics |
tempo |
tempo |
the uid of the Grafana datasource reading Tempo |
folder |
terragucci |
the Grafana folder for the dashboards and the Grafana-managed rules |
path |
/var/lib/grafana/dashboards/terragucci |
where Grafana finds the dashboard files |
drift_age, wave_wait, schedule |
1d, 4h, 2d |
the alert thresholds |
Mount grafana/provisioning/ under /etc/grafana/provisioning/ and grafana/dashboards/ at path. Add prometheus/terragucci.rules.yml to rule_files. Page from the alerting file or the ErrorBudgetBurn alerts, not both.
Span metrics
Section titled “Span metrics”The dashboards read span metrics from a spanmetrics connector in your collector:
connectors:
  spanmetrics:
    namespace: terragucci.spans
    dimensions:
      - name: terragucci.stage
      - name: terragucci.project
      - name: terragucci.result
    resource_metrics_key_attributes: [service.name, terragucci.project]
    histogram:
      unit: s
      explicit:
        buckets: [5s, 15s, 30s, 60s, 120s, 300s, 600s, 1200s, 1800s, 3600s]
Only the Runs dashboard’s trace list needs Tempo.
Links to reports
Section titled “Links to reports”With reports.url set, the Runs dashboard links each trace to traces/<trace id>.html and Estate links each project to its report index.

These docs count page views and clicks with PostHog. They set no cookies, store nothing in your browser, and send nothing when your browser asks not to be tracked.